1. Home
  2. /
  3. Investing

Investing

The Indian benchmark indices, NIFTY and SENSEX, experienced an upward trend on 28th January as the bank stocks surged after the RBI announcement. The major bank stocks, including HDFC Bank, IDFC First Bank, IndusInd Bank, and ICICI Bank shares, rose by around 2-3%, and the Bank NIFTY reached an intraday high of Rs.49,247.15.

AD 4nXcvALxT8Zn1WpMSOHKcZWYmvlQlj sXMuNtd4SgcpJ0YGvomTBwktT6b7iNwPu2fae2N0I3AlOIsDXWhG2DJA7oNUtkuskc 4BjjQ2aCXJkUx gPZOXjt fBp7NofoVL6L3jIGM Q?key=7QuuvuKtLMJsrFqr5IC uhRz
Source: NSE

What RBI measures caused this surge, and what does it mean for the investors? Let’s understand. 

The RBI Announcement

The Reserve Bank of India plans to inject Rs.1.5 lakh crore worth of liquidity into the economy and banking system. This announcement follows a Rs.3.1 lakh crore deficit recognized in the banking system. The infusion of liquidity will be done through the following measures-

Government Securities (G-Secs) Purchases:

The RBI will buy Rs.60,000 crore worth of G-Secs in three tranches (Rs.20,000 crore each) through Open Market Operations (OMOs), which will take place on 30th January, 13th February, and 20th February.

    Variable Rate Repo (VRR) Auction:

    A Rs.50,000 crore VRR auction is set for 7 February to inject liquidity for 56 days.

      Dollar-Rupee Sell Swap Auction:

      A $5 billion swap auction on 31st January will provide liquidity by exchanging dollars for rupees.

        The RBI’s steps are expected to stabilize the liquidity situation, providing banks with a durable source of funds. This is critical as the RBI has been intervening in the forex market to manage rupee volatility. These actions could also signal a potential interest rate cut, as boosting liquidity is crucial for effective policy transmission. The next RBI meeting in early February will likely reveal the future course of action.

        Overview Of What Are These Measures:

          Government Buying G-Secs Through OMO

          Open Market Operations (OMO) is a tool used by the RBI to manage liquidity in the banking system by buying or selling government securities (G-secs). In this process, the government, via the central bank, purchases G-secs in the open market to inject money into the economy. This action increases the money supply, lowering interest rates and stimulating economic growth. 

          When the RBI buys G-secs, it pumps more money into circulation, encouraging borrowing and spending by businesses and individuals. The ultimate goal is to boost economic activity, especially when growth is needed or inflation is under control. On the other hand, selling G-secs would pull money out of the system, helping to curb inflation if necessary.

            Variable Rate Repo (VRR) Auction

            The Variable Rate Repo (VRR) auction is a short-term liquidity adjustment tool the RBI uses to manage the banking system’s liquidity. In this auction, banks borrow funds from the RBI at a variable interest rate, which is determined through bidding. The RBI sets the amount to be auctioned based on current liquidity conditions and announces these details in advance. 

            VRR auctions are typically conducted when the weighted average call money rate (which reflects short-term borrowing costs) exceeds the repo rate, signaling a liquidity crunch. By allowing banks to borrow funds at a rate set through the auction, the RBI helps ease liquidity concerns, stabilizing interest rates and aligning them with its monetary policy objectives. 

            VRR auctions generally last from overnight to 13 days, with longer tenures being rare. This tool helps balance market conditions and ensures the banking system remains liquid.

              Dollar-Rupee Sell Swap Auction

              The Dollar-Rupee Sell Swap Auction is a method the RBI uses to manage the rupee’s exchange rate. In this auction, the RBI sells US dollars to banks in exchange for rupees and agrees to repurchase them later. This reduces rupee liquidity in the system, helping to support the rupee against depreciation. By conducting these swaps, the RBI stabilizes the foreign exchange market and controls excessive fluctuations in the rupee’s value, especially during global volatility or rising crude oil prices.

              What Does It All Mean for Investors?

              The RBI’s liquidity boost is a positive sign for investors, especially for bank stocks like HDFC, ICICI, and Axis Bank. With measures like government securities purchases, VRR auctions, and Dollar-Rupee swaps, the RBI ensures banks have ample liquidity to operate smoothly. This stability can improve banks’ profitability, which could boost their stock prices.

              Additionally, these steps might signal an interest rate cut, which would reduce borrowing costs and potentially spur economic activity. For investors, lower rates make equities more attractive compared to fixed-income options.

              Overall, the RBI’s actions provide stability and confidence, particularly for the banking sector, and suggest a more favorable environment for growth in the near term. As always, it’s essential to stay updated on how these measures impact the market and take your investment decisions accordingly.

              FAQs

              1. What is OMO?

                OMO (Open Market Operations) is a tool central banks, like the RBI, use to manage liquidity in the economy. It involves buying or selling government securities (G-secs) in the open market.

              2. What is meant by Repo Rate?

                The repo rate is the interest rate at which commercial banks borrow funds from the central bank, using government securities as collateral. The current repo rate is 6.5%.

              3. Is liquidity management related to managing inflation? How?

                Yes, liquidity is closely related to managing inflation. When there’s excess liquidity (too much money in circulation), demand can surpass supply, leading to higher prices and inflation. Central banks reduce liquidity by raising interest rates or selling government securities to control inflation, discouraging borrowing and spending. Conversely, increasing liquidity can stimulate demand and economic activity during deflation or low inflation.

              Dalal Street is set for a busy week as two new initial public offerings (IPOs) debut and six scheduled stock listings. Despite bearish sentiment and volatility in the secondary market, the primary market remains active. Investors will have the chance to explore two new IPOs for subscription, one from the mainboard and the other from the SME segment, starting January 27. Source: Moneycontrol

              Adding to the buzz, the Denta Water IPO allotment is happening today. This IPO is entirely a fresh issue of 0.75 crore shares. Founded in 2016, Denta Water and Infra Solutions Ltd has established itself as a key player in water Engineering, Procurement, and Construction (EPC) services. Source: ET Now

              Let’s dive into the details to understand what’s in store for investors.

              IPO Details of Dr. Agarwal’s Health Care Ltd.

              Dr. Agarwal’s Healthcare IPO is a book-built issue valued at ₹3,027.26 crores. It comprises a fresh issue of 0.75 crore shares worth ₹300 crores and an offer for sale of 6.78 crore shares totaling ₹2,727.26 crores.

              Offer Price₹382 to ₹402
              Face Value₹1 per Share
              Opening DateJanuary 29, 2025
              Closing DateJanuary 31, 2025
              Total Size  (in Shares)7,53,04,970 shares (Fresh Issue)
              6,78,42,284 shares (OFS)
              Total Issue Size (in ₹) ₹2,727.26 Cr
              Issue TypeBook Built Issue
              Lot Size35 Shares
              Listing atBSE, NSE
              Source: Chittorgarh

              Company Overview

              Dr. Agarwal’s Health Care Ltd. is a leading eye care provider in India, offering a comprehensive range of services, including eye examinations, laser vision correction (LASIK, SMILE), cataract surgery, glaucoma treatment, and more. With a vast network of clinics nationwide, they prioritize patient care and utilize advanced technology and experienced ophthalmologists to deliver high-quality eye care solutions.

              Swot Analysis of Dr. Agarwal’s Health Care Ltd IPO

              STRENGTHSWEAKNESSES
              Strong Brand Reputation: Dr. Agarwal’s is a well-established and trusted name in the Indian eye care market.

              Large Network: Extensive clinics across India, ensuring wide reach and accessibility.

              Experienced Team: A team of highly skilled and experienced ophthalmologists.

              Growing Market: The Indian eye care market is projected to grow significantly in the coming years.
              Competition: Intense competition from other established players and new entrants.

              Price Sensitivity: Price sensitivity among a significant portion of the Indian population.

              Reliance on a Few Procedures: Revenue concentration in key procedures like cataract surgery.

              Geographic Concentration: Revenue concentration in certain regions.
              OPPORTUNITIESTHREATS
              Expansion into Tier II and Tier III Cities: Further expansion into untapped markets.

              Diversification of Services: Expanding service offerings to include new specialties like oculoplastics and neuro-ophthalmology.

              Telemedicine and Digital Health: Leveraging technology for remote consultations and patient care.

              International Expansion: Exploring opportunities for global expansion.
              Government Regulations: Shifts in healthcare-related government policies and regulations.

              Economic Slowdown: Economic downturn affecting consumer healthcare spending.

              Technological Disruptions: Introduction of new technologies and treatment alternatives.

              Changes in Consumer Behavior: Evolving consumer preferences and expectations in healthcare.

              IPO Details of Malpani Fitting & Pipes

              The price band for Malpani Pipes IPO is between ₹85 and ₹90 per share, with a minimum application size of 1,600 shares. Retail investors need to invest at least ₹1,44,000, while the minimum investment for HNIs is two lots (3,200 shares), amounting to ₹2,88,000.

              Offer Price₹85 to ₹90
              Face Value₹10 per Share
              Opening DateJanuary 29, 2025
              Closing DateJanuary 31, 2025
              Total Size  (in Shares)28,80,000 shares
              Total Issue Size (in ₹) ₹25.92 Cr
              Issue TypeBook Built Issue
              Lot Size1600 Shares
              Listing atBSE, NSE
              Source: Chittorgarh

              Company Overview

              Malpani Pipes & Fittings Ltd. is an Indian manufacturer of high-quality plastic pipes and fittings. Based in Madhya Pradesh, it specializes in many products, including HDPE pipes, MDPE pipes, sprinkler pipes, drip irrigation pipes, and more. The company is known for its commitment to quality and customer satisfaction and adheres to ISO 9001:2015 standards.

              SWOT Analysis of Malpani Fitting & Pipes IPO

              STRENGTHSWEAKNESSES
              Experienced Management: The company has a seasoned management team with a proven track record in the plastic pipes and fittings industry.

              Strong Market Presence: Malpani Pipes has a well-established presence in the Indian market, particularly in the northern region.

              Diverse Product Portfolio: Offers products catering to various applications, including agriculture, irrigation, and infrastructure.

              Focus on Quality: Adherence to ISO 9001:2015 quality standards ensures consistent product quality.
              Geographic Concentration: Revenue concentration in a specific region (Northern India) may limit growth potential.

              Dependence on a Single Manufacturing Facility: Reliance on a single manufacturing facility could disrupt operations in case of unforeseen events.

              Competition: The plastic pipes and fittings industry is highly competitive with numerous established players.

              Raw Material Price Fluctuations: Fluctuations in raw material prices can impact profitability.
              OPPORTUNITIESTHREATS
              Expand Geographic Reach: Increase market penetration in other regions of India.

              Diversify Product Portfolio: Explore new product lines and applications to broaden revenue streams.

              Increase Market Share: Gain market share through strategic partnerships and aggressive marketing.

              Leverage Government Initiatives: Benefit from government infrastructure development and water management initiatives.
              Changes in Government Regulations: Changes in government regulations related to the industry could impact operations.

              Entry of New Competitors: Entry of new players could intensify competition and erode market share.

              Environmental Concerns: Growing environmental concerns could lead to stricter regulations and increased costs.

              In addition, the Denta Water IPO allotment is taking place today. The IPO is set to be listed on Dalal Street, tentatively on Wednesday, January 29, 2025.

              Denta Water IPO shares are trading at a premium of approximately 40% over the upper price band (Rs 294 per share) in the grey market, an unofficial platform for IPO shares trading before the official listing, according to market observers. Source: ET Now

              IPO Details of Denta Water and Infra

              Offer Price₹279 to ₹294 per share
              Face Value₹10 per share
              Opening Date22 January 2025
              Closed on24 January 2025
              Total Issue Size (in Shares)75,00,000
              Total Issue Size (in ₹)₹220.50 Cr
              Issue Type Book Built Issue IPO
              Lot Size50 Shares
              Listing atBSE, NSE
              Source: SEBI

              How to Check Denta Water IPO Allotment Status

              To check if you have been allotted shares in the Denta Water public issue IPO, follow these simple steps:

              Visit the Integrated Registry Allotment Page

              Go to the Integrated Registry’s IPO allotment page via the following link: Integrated Registry IPO Allotment.

                Select the IPO

                From the drop-down menu, choose “Denta Water” as the company name.

                  Enter Your Details

                  You can check your allotment status by entering your PAN number, IPO Application number, or DP client ID/Demat account number.

                    View Allotment Status

                    Tap the ‘Search’ button, and the screen will display the status of your IPO allocation, showing both the shares you applied for and those allocated to you.

                      Check IPO Allotment Status on BSE

                      Alternatively, you can also check your allotment status on the BSE website:

                      Visit the BSE IPO Allotment Page

                      Go to BSE IPO Allotment.

                        Select the IPO Name

                        Select the company name for the Denta Water IPO from the drop-down menu.

                          Enter Your Details

                          To view your allocation status, enter your application number or PAN number.

                            IPOs Closing Next Week

                            CLN Energy’s Rs 72-crore IPO will close on January 27, while the bidding for GB Logistics Commerce and HM Electro Mech public offerings will end on January 28. CLN Energy’s IPO was subscribed 2.68 times in the past two days, while GB Logistics Commerce and HM Electro Mech IPOs were fully subscribed on their first day of bidding, January 24, at 5.44 times and 7.32 times, respectively. Source: Moneycontrol

                            Six Listings Scheduled for Next Week

                            In addition to the IPOs, six companies are set to debut on Dalal Street. These include a mix of small and mid-sized firms across various sectors. Each listing brings unique value propositions, offering investors diverse opportunities.

                            SME Segment Debuts

                            The remaining five companies, all from the SME segment, will also list this week. Capital Numbers Infotech will debut on the BSE SME platform on January 27, while Rexpro Enterprises shares will begin trading on the NSE Emerge platform on January 29. Source: Moneycontrol

                            Upcoming SME Listings

                            Investors will also be able to start trading CLN Energy shares on the BSE SME on January 30, followed by GB Logistics Commerce and HM Electro-Mech, whose shares will be available for trading on January 31.

                            Source: Moneycontrol

                            Dalal Street is set for significant market activity with two IPOs and six upcoming listings featuring prominent mainboard and SME players. The week will see heightened activity and increased investor interest as the market readies itself for these listings.

                            Related Posts

                            Introduction to the Book Building Process

                            The book-building process of IPOs is a cornerstone of modern equity markets, providing an efficient way to determine the right price for a company’s shares during its Initial Public Offering (IPO). Understanding this mechanism is key to making informed investment decisions for retail and institutional investors.

                            This comprehensive guide will delve into the book-building method, its benefits, advantages, and steps, helping you master the process for IPO investments.

                            What is Book Building in IPOs?

                            The term book building refers to the method by which companies price their shares for an IPO. Unlike the fixed-price method, book building IPOs allow market participants to bid for shares within a specified price range, called the price band. This process reflects real-time demand and helps issuers and underwriters set a fair market price.

                            Why is the Book Building Method Important for Price Discovery?

                            The book-building process of IPO plays a crucial role in price discovery by factoring in market demand and investor sentiment. It ensures that shares are neither overpriced nor underpriced, leading to potential losses for the issuing company.

                            Steps in the Book-Building Process

                            Determination of the Price Band

                            How Underwriters Set the Floor and Cap Prices

                            The Book Building Process steps begin with underwriters assessing the issuing company’s valuation, market conditions, and industry trends. They then set a price band with a lower (floor) and upper (cap) limit, providing investors with a range within which to bid.

                            Bidding by Investors

                            Institutional and Retail Investor Participation in Book Building

                            Both institutional and retail investors submit their bids, specifying the number of shares and the price they are willing to pay within the band. This phase often involves significant participation from qualified institutional buyers (QIBs), as they help gauge market demand.

                            Compilation of Bids and Price Discovery

                            Determining the Cut-Off Price Through Demand Analysis

                            Once bidding concludes, underwriters compile the bids and analyze demand at various price points. The cut-off price, or the final price at which shares are issued, is determined based on the highest demand within the price band.

                            Allocation of Shares

                            How Shares Are Distributed Based on Bids

                            After price discovery, shares are allocated to investors. Retail investors often receive shares at the cut-off price, while institutional buyers may have varying allotments based on their bid prices. The IPO allotment process is guided by SEBI regulations to ensure fairness.

                            Types of Book Building in IPOs

                            100% Book Building Process

                            Definition and Key Characteristics

                            In a 100% book-building IPO, the entire offering is priced using the book-building method, encouraging wide market participation. Both institutional and retail investors can bid within a set price range, helping determine the share price based on demand. 

                            This process ensures efficient price discovery and makes the IPO allotment process transparent, as shares are allocated based on the strength of bids and overall demand.

                            75% Book Building Process

                            How It Differs From the 100% Method

                            In this method, 75% of the shares are priced through book building, where bids within a price range help set the price based on demand. The remaining 25% are offered at a fixed price, providing a simple option for some investors. This approach balances flexibility and simplicity, appealing to new and experienced investors. 

                            It also encourages broader participation and ensures demand-driven pricing for listed IPOs, boosting their appeal and transparency.

                            Advantages of the Book Building Method

                            Efficient Price Discovery Mechanism

                            The book building process engages market participants to determine the share price based on demand. This ensures the pricing reflects real market interest, minimizing the chances of shares being undervalued or overvalued. Issuers gain insights into investor preferences by collecting bids across a price range. This leads to a fair and efficient price discovery mechanism that benefits both the company raising funds and the investors seeking returns.

                            Increased Transparency in IPO Pricing

                            Book building promotes transparency by allowing investors to monitor demand trends during bidding. Participants can adjust their bids based on real-time data, ensuring they are informed about market dynamics. This open approach builds trust in the IPO allotment process, as investors feel confident that shares are allocated fairly based on demand and bidding strength, making the IPO process more reliable and investor-friendly.

                            Flexibility for Institutional and Retail Investors

                            The book building method caters to institutional and retail investors by allowing them to bid within a set price range. Institutional investors benefit from the ability to place large bids with detailed analysis, while retail investors enjoy access to a structured process that encourages their participation. This inclusivity ensures diverse representation, fostering a balanced and competitive environment in the IPO market.

                            Limitations of the Book Building Process

                            Complexity in Bidding for Retail Investors

                            The book building process can be challenging for first-time or less-experienced investors. Understanding terms like price bands, cut-off prices, and bid quantities may feel technical and overwhelming. Retail investors also compete with institutional investors with more resources and market insights, discouraging retail participation and reducing their opportunities in IPOs.

                            Dependence on Market Sentiment for Pricing

                            The book building method relies heavily on market sentiment, which can distort IPO pricing. Positive sentiment may inflate prices, overvaluing shares, while negative sentiment can suppress valuations. This dependence means prices often reflect market trends rather than a company’s true value, posing risks for both investors and issuers if prices don’t hold long-term.

                            Risk of Oversubscription and Underpricing

                            When demand is high, IPOs may become oversubscribed, leaving retail investors with fewer shares than expected. On the other hand, underpricing occurs when demand is underestimated, causing issuers to lose revenue. These imbalances disrupt market dynamics, making it crucial to balance demand and pricing for a successful IPO.

                            Comparison: Book Building vs Fixed Price IPOs

                            Key Differences in Pricing, Demand, and Transparency

                            Pricing: Book building relies on demand-driven pricing, while fixed price IPOs have predetermined prices.

                            Demand: Book building gauges real-time demand, whereas fixed price IPOs estimate demand in advance.

                            Transparency: The book building method is more transparent, as bids are openly analyzed.

                            Which Method is Better for Investors?

                            For retail investors, book building typically offers more accurate pricing, reflecting real-time demand and ensuring that shares are priced based on market interest. However, it can be complex for those new to investing. In contrast, fixed price IPOs are simpler, with a set price for shares, making them easier to understand. Investors can explore a complete IPO list to compare both methods and decide which aligns with their investment strategy.

                            How to Participate in a Book Building IPO

                            Step-by-Step Guide for Retail Investors

                            Choose a broker: Select a brokerage platform offering IPO services.

                            Submit bids: Place bids within the price band for your desired quantity.

                            Use ASBA: Ensure funds are blocked using the ASBA (Applications Supported by Blocked Amount) facility.

                            Monitor allocation: After the IPO closes, check the allotment status.

                            Understanding the Role of ASBA in the Bidding Process

                            ASBA (Application Supported by Blocked Amount) streamlines the payment process for IPOs by blocking the required funds in your bank account until shares are allotted. Unlike traditional methods where funds are transferred upfront, ASBA ensures that the money remains in your account and is only deducted when shares are successfully allotted. This approach prevents unnecessary transfers and ensures that funds are only debited if your application is successful in the IPO allotment process.

                            How Equentis Supports Book Building IPO Investments

                            Tracking Book Building IPOs

                            Equentis offers tools that allow investors to track demand and bidding trends during the book building process. This helps investors stay updated on the IPO status, making adjusting their bids and strategies easier based on current market activity.

                            Conclusion

                            The book building process is a key component of contemporary IPO pricing, providing an efficient, transparent, and flexible method for price discovery. Investors can make more informed decisions with insights into its steps, benefits, and potential drawbacks. A stock market advisory company can guide you through this process to enhance your investment strategy.

                            FAQ

                            1. What is the Book Building Process?

                              The Book Building Process is a method for determining an IPO’s offer price. Investment banks act as intermediaries, gathering bids from potential investors at various price points. This information helps determine the optimal offer price that maximizes demand while ensuring a successful IPO.

                            2. How does the Book Building Process work?

                              Investment banks collect bids from institutional investors and high-net-worth individuals. These bids indicate the quantity of shares they are willing to buy at different prices. Based on this data, the underwriters analyze market demand and recommend an offer price to the issuing company.

                            3. What are the advantages of the Book Building Process?

                              The book building process offers several advantages, starting with price discovery, where it accurately reflects market demand and ensures a fair IPO price. This method also enhances efficiency by streamlining the IPO process, reducing time to market.

                            4. Who are the key players in the Book Building Process?

                              Several key players contribute to the success of the book building process. The issuing company, which is going public, is at the heart of the process. Investment banks act as underwriters, managing the IPO and guiding the pricing. Institutional investors, including mutual funds, pension funds, and insurance companies, play a significant role by placing large bids.

                            With around 81 companies announcing their third-quarter results for FY2024-25, the market is witnessing a mixed trend in Q3 results. Some companies are experiencing an increase in profits, while others are facing a downturn in their Q-o-Q figures. Among this fleet of financial results, MakeMyTrip has mainly made headlines with its 24% revenue growth in the December 2024 quarter. 

                            What propelled this growth? And has the company shown similar growth in other financial parameters? Let’s understand the top 3 highlights and reasons for the positive surge of MakeMyTrip. 

                            Overview of MakeMyTrip:

                            AD 4nXf0DcD B2qMxHQr2jGGL0YprgM8

                            Source: NASDAQ

                            Deep Kalra founded MakeMyTrip in 2000. It is a leader in India’s online travel sector. Initially serving the US-India travel market, it expanded to India in 2005. As low-cost airlines gained traction, MakeMyTrip became a go-to platform for booking flights, hotels, and holiday packages. The company has since diversified into homestays, villas, and ground transportation services, including cabs, buses, and trains.

                            MakeMyTrip is also expanding into the business travel space with myBiz and creating an exclusive platform for travel agents, myPartner. Recently, the company entered the Gulf market, offering competitive deals on flights and hotels. The company remains a dominant player in online travel bookings with its three brands—MakeMyTrip, Goibibo, and RedBus.

                            Listed on NASDAQ as MMYT, MakeMyTrip has a current stock price of $109.44 and an EPS of $0.46. Its latest quarter, ending December 2024, reported earnings of $0.39 per share, a slight increase from $0.35 a year ago, adjusted for non-recurring items.

                            Highlights Of The Q3 Financial Results:

                            Net Profit Trend:

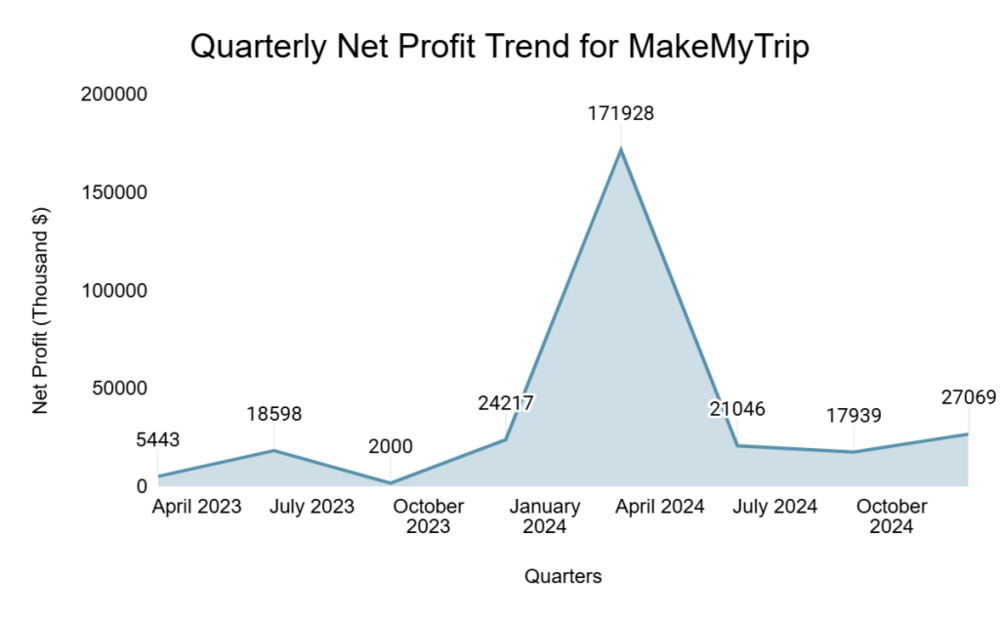
                            MakeMyTrip has seen an overall increase in the quarterly net profit, with the latest increase being 11.8% y-o-y as of the December 2024 quarter. The sudden spike in the profit in the March 2024 quarter happened because the company achieved its highest-ever annual gross booking, witnessed high repeat rates, and optimized tech costs due to a unified back-end Infrastructure. 

                            image 16
                            Source: MakeMyTrip

                            Revenue:

                            image 17
                            Source: MakeMyTrip

                            Gross Bookings:

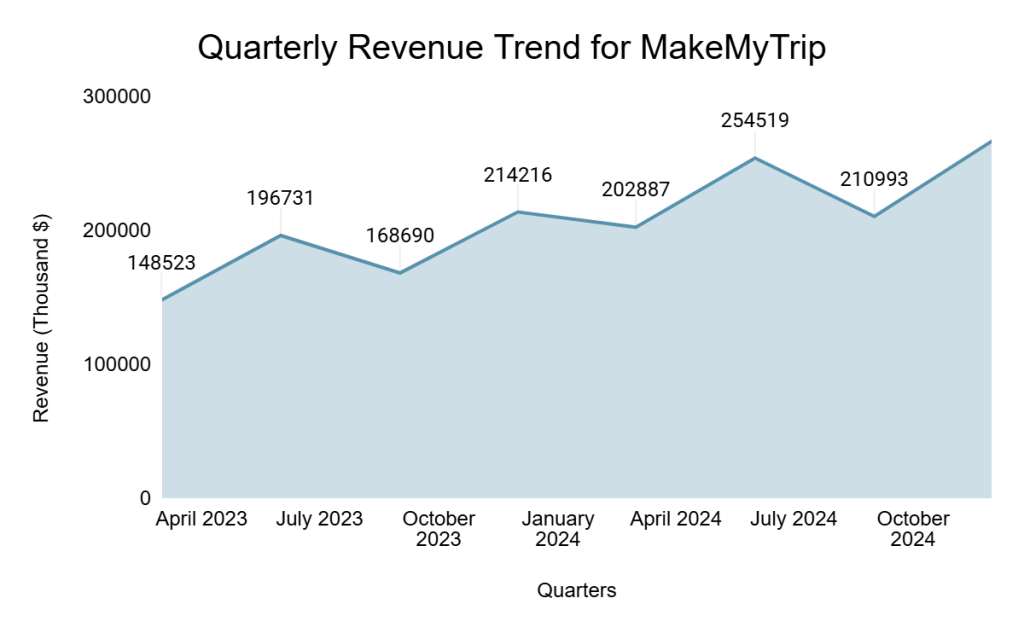
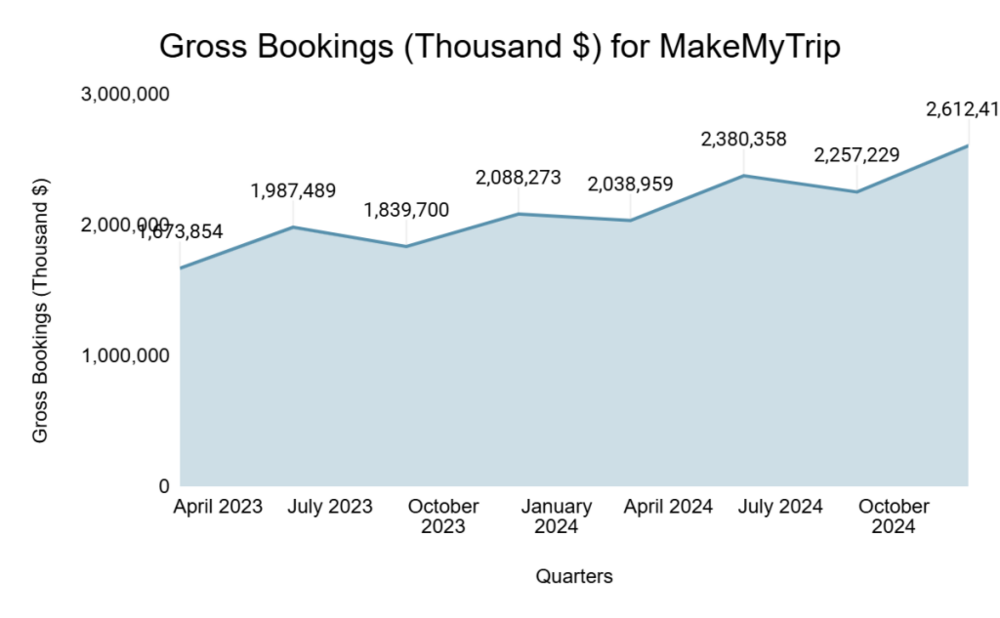
                            The company’s quarterly revenue trend has been upward. In the December 2024 quarter, revenue reached $267,362 thousand, a 24.8% year-on-year increase over December 2023 ($214,216 thousand). 

                            The increase was mainly due to strong travel demand in India, both for domestic and international outbound travel, during the quarter ending 31 December 2024 compared to the same period in 2023.

                            image 18
                            Source: MakeMyTrip

                            Reasons For The Surge:

                            1. Growth In Air Ticketing:

                            The air ticketing segment earned $61.3 million in revenue, an 18% increase from $51.7 million in 2023. However, nearly half of this revenue, $32.4 million, was spent on customer inducement costs, such as discounts and promotions. 

                            Despite the rise in revenue, profit as a percentage of gross bookings decreased slightly to 6.1%, down from 6.3% in the same quarter last year. The adjusted margins also declined somewhat. Even though the revenue grew, higher costs for discounts and incentives led to a slight dip in profitability, with adjusted margins decreasing from 6.3% to 6.1%.

                            1. Growth In Bookings Of Hotel Packages:

                            MakeMyTrip’s hotel and package business grew by 17.2%, reaching $147.1 million for the quarter, up from $125.5 million in 2023. This growth was driven by a 21.9% rise in gross bookings, fueled by more hotel room nights being booked as travel both within India and internationally increased.

                            Profits also saw a 23.4% rise, reaching $121.9 million, up from $98.8 million last year. However, discounts and promotions impacted profitability. Higher costs associated with these promotions increased to $44.1 million, up from $35.7 million in the previous year. Despite this, the adjusted margin as a percentage of revenue slightly improved from 17.7% to 17.9%.

                            1. Growth In Bus Ticketing Segment:

                            The bus ticketing business saw impressive growth of 31.7% this quarter. Revenue reached $31.8 million, up from $24.2 million in the same quarter last year. A rise in demand for bus travel drove this growth. Additionally, profitability in the bus ticketing segment increased by 30.2%, showing strong performance.

                            Besides these, the company’s quarterly performance was also affected by a recent development in MakeMyTrip (India) Pvt. Ltd. In the third quarter of FY2025, the company’s wholly-owned subsidiary, MakeMyTrip (India) Private Limited (“MakeMyTrip India”), signed a business transfer agreement to acquire a corporate travel and expense management business under the “HAPPAY” brand from VA Tech Ventures Private Limited. The acquisition is valued at up to INR 1.0 billion (or $11.7 million), subject to certain adjustments. Source: Company Press Release

                            Bottomline:

                            The Indian travel and tourism sector is growing rapidly, with travelers eager to explore new destinations. While Indian destinations remain popular, countries also intensify efforts to attract Indian travelers. 

                            The company’s strong financial performance this quarter demonstrates the successful execution of strategic priorities and the resilience of the travel sector. By focusing on cost management and investing in technology and customer experience, the company has capitalized on the growing travel demand, driving profitable growth.

                            However, as the market evolves, these trends may offer opportunities to strengthen operations along with a scope of further considerations with respect to the growth and marketing plans. So, if you plan to invest in MakeMyTrip, thoroughly research the market factors and company fundamentals to ensure it aligns with your portfolio goals. 

                            India’s corporate giants dominate their respective industries, consistently influencing India’s economic narrative. This blog takes a closer look at the financial metrics of the top ten companies by market capitalization, highlighting their contributions and performances. 

                            These companies are some of India’s best large cap stocks, offering a glimpse into the strength of the country’s corporate sector. As per SEBI, large-cap stocks are the first 100 companies in terms of full market capitalization. These stocks can be found in major indices like Nifty 50, Nifty 100, and Nifty Next 50. 

                            This blog can provide valuable insights if you want to invest in large-cap stocks. These are the top 10 large cap stocks per their market capitalization. For detailed analysis, consider using a stock screener or seeking investment advisor services to guide your decisions.

                            Reliance Industries

                            MetricValue
                            Market Price (Rs)1240.85
                            Market Cap (Rs Cr)16,78,888.35
                            Debt-to-Equity0.44
                            Annual Sales FY25 (Rs Cr)9,24,938
                            ROE (%)9.25
                            ROCE (3-yr Avg %)8.99
                            EBITDA (Rs Cr)1,78,942
                            Source: Screener.in (07-01-2025)

                            Reliance Industries, a conglomerate with interests spanning energy, retail, and telecommunications, has been a household name in India for decades. Its current market price is Rs. 1240.85, with a market capitalization of Rs. 16,78,888.35 crore, making it India’s largest company by revenue. This large cap stock is a cornerstone of the Indian economy. With a debt-to-equity ratio of 0.44, Reliance manages its finances efficiently. The company’s annual sales stand at Rs. 9,24,938 crore, which reflects its massive scale of operations. While its ROE is 9.25% and its three-year ROCE average is 8.99%, Reliance’s EBITDA of Rs. 1,78,942 crore indicates strong profitability.

                            Tata Consultancy Services (TCS)

                            MetricValue
                            Market Price (Rs)4028.30
                            Market Cap (Rs Cr)14,57,580.98
                            Debt-to-Equity0.09
                            Annual Sales FY25 (Rs Cr)2,48,692
                            ROE (%)51.51
                            ROCE (3-yr Avg %)59.14
                            Source: Screener.in (07-01-2025)

                            TCS has established itself as a global leader in IT services. Its market price is Rs. 4028.30, with a capitalization of Rs. 14,57,580.98 crore. This large cap stock demonstrates exceptional financial health and a strong global presence. The company’s financials reflect stability, with an ROE of 51.51% and a three-year ROCE average of 59.14%. TCS maintains a minimal debt-to-equity ratio of 0.09, indicating strong financial discipline. With annual sales of Rs. 2,48,692 crore, TCS has grown consistently.

                            HDFC Bank

                            MetricValue
                            Market Price (Rs)1713.40
                            Market Cap (Rs Cr)13,10,615.63
                            Annual PAT (Rs Cr)69,181
                            ROE (%)17.14
                            Profit Variation (3-yr Avg %)26.19
                            Source: Screener.in (07-01-2025)

                            HDFC Bank is a significant player in India’s banking sector. Its market price is Rs. 1713.40, with a market capitalization of Rs. 13,10,615.63 crore. As one of the most prominent large cap stocks. HDFC Bank reported a PAT of Rs. 69,181 crore, with a three-year profit growth variation of 26.19% and an ROE of 17.14%. 

                            Bharti Airtel

                            MetricValue
                            Market Price (Rs)1590.85
                            Market Cap (Rs Cr)9,52,599.28
                            Debt-to-Equity2.59
                            EBITDA (Rs Cr)82,436
                            Debt-to-Profit Ratio26.35
                            P/E Ratio67.17
                            Source: Screener.in (07-01-2025)

                            Bharti Airtel, a telecom giant, has a market price of Rs. 1590.85 and a market capitalization of Rs. 9,52,599.28 crore. This large cap stock is a leader in the telecom industry, benefiting from the surge in data consumption. Its P/E ratio of 67.17 highlights the company’s premium valuation. Airtel’s debt-to-equity ratio of 2.59 and a debt-to-profit ratio of 26.35 points to significant leverage, although its EBITDA of Rs. 82,436 crore ensures operational profitability. 

                            ICICI Bank

                            MetricValue
                            Market Price (Rs)1279.25
                            Market Cap (Rs Cr)9,02,906.73
                            Annual PAT (Rs Cr)47,367.73
                            ROE (%)18.80
                            Profit Variation (3-yr Avg %)34
                            Source: Screener.in (07-01-2025)

                            ICICI Bank’s market price is Rs. 1279.25, with a market capitalization of Rs. 9,02,906.73 crore. As a large capital stock, ICICI Bank plays a vital role in India’s banking ecosystem. Its PAT of Rs. 47,367.73 crore and a three-year profit growth variation of 34% are strong indicators of its financial health. ICICI Bank’s ROE of 18.80% and operational strength make it a key player in the banking sector.

                            Infosys

                            MetricValue
                            Market Price (Rs)1930.85
                            Market Cap (Rs Cr)8,01,740.90
                            Debt-to-Equity0.10
                            Annual Sales FY25 (Rs Cr)1,57,045
                            ROE (%)31.83
                            ROCE (3-yr Avg %)39.12
                            Source: Screener.in (07-01-2025)

                            Infosys is another IT powerhouse, with a market price of Rs. 1930.85 and a market capitalization of Rs. 8,01,740.90 crore. This large capital stock excels in delivering consistent growth and high profitability. The company’s ROCE of 39.99% and ROE of 31.83% reflect its high profitability. Infosys’ low debt-to-equity ratio of 0.10 and annual sales of Rs. 1,57,045 crore showcase its strong market position and operational excellence.

                            State Bank of India (SBI)

                            MetricValue
                            Market Price (Rs)778.75
                            Market Cap (Rs Cr)6,94,691.62
                            Annual Sales FY25 (Rs Cr)4,69,624.85
                            Debt-to-Profit Ratio80.61
                            PAT (Rs Cr)76,568.63
                            Profit Variation (3-yr Avg %)44.11
                            Source: Screener.in (07-01-2025)

                            SBI, India’s largest lender, showcases a significant market presence. This large cap stock is reflecting the scale of its lending operations. Despite challenges in managing such a vast portfolio, the bank has demonstrated remarkable profit growth, with a three-year average profit variation of 44.11%. With annual sales of Rs. 4,69,624.85 crore, SBI remains a key pillar in India’s financial ecosystem.

                            Hindustan Unilever (HUL)

                            MetricValue
                            Market Price (Rs)2390.80
                            Market Cap (Rs Cr)5,61,515.79
                            Debt-to-Equity0.03
                            Annual Sales FY25 (Rs Cr)62,410
                            ROE (%)20.24
                            ROCE (3-yr Avg %)26.12
                            Source: Screener.in (07-01-2025)

                            Hindustan Unilever dominates the FMCG sector with its diverse product range. This large cap stock’s low debt-to-equity ratio of 0.03 highlights its financial prudence. Its annual sales of Rs. 62,410 crore and three-year ROCE average of 26.12% emphasize consistent performance and market leadership. 

                            ITC

                            MetricValue
                            Market Price (Rs)441.10
                            Market Cap (Rs Cr)5,52,078.63
                            Debt-to-Equity0.00
                            Annual Sales FY25 (Rs Cr)75,135.27
                            ROE (%)28.43
                            ROCE (3-yr Avg %)36.64
                            Source: Screener.in (07-01-2025)

                            ITC stands out with its diversification across FMCG, hotels, and agri-business. This large capital stock reflects financial stability, with a near-zero debt-to-equity ratio. It has sales of Rs. 75,135.27 crores and a three-year ROCE average of 36.64%.

                            HCL Technologies

                            MetricValue
                            Market Price (Rs)1915.90
                            Market Cap (Rs Cr)5,20,097.50
                            Debt-to-Equity0.08
                            Annual Sales FY25 (Rs Cr)1,13,864
                            ROE (%)23.30
                            Profit Variation (3-yr Avg %)12.31
                            Source: Screener.in (07-01-2025)

                            HCL Technologies, a leading IT services company, has consistently performed well. This large cap stock’s low debt-to-equity ratio of 0.08 ensures a sound financial position. The company’s sales of Rs. 1,13,864 crore and a three-year profit growth variation of 12.31% maintain the company’s position as one of the market leaders.

                            Conclusion

                            India’s top companies play a vital role in shaping the country’s economy. One can better understand their market positions by exploring ROE, ROCE, debt-to-equity ratios, and profit variations. These companies reflect the diversity and growth potential across IT, banking, FMCG, and telecom sectors, offering insights for anyone interested in India’s corporate landscape.

                            Related Posts

                            FAQ

                            1. What are the criteria for selecting these top 10 companies?

                              The selection is based on market capitalization, financial metrics such as ROE, ROCE, debt-to-equity ratio, and overall performance over the last three years. These metrics help identify leaders across various sectors.

                            2. Why is market capitalization an important metric?

                              Market capitalization reflects the total value of a company’s outstanding shares and gives investors an idea of its size, stability, and influence in the market.

                            3. What is the significance of ROE and ROCE?

                              ROE (Return on Equity) measures a company’s profitability relative to shareholders’ equity. At the same time, ROCE (Return on Capital Employed) evaluates how efficiently a company uses its capital, including debt, to generate returns. Both are key indicators of financial performance.

                            4. Why do some companies have a high debt-to-equity ratio?

                              A high debt-to-equity ratio often indicates a capital-intensive business model, as seen in sectors like banking and telecom, where companies leverage debt to finance growth and operations.

                            5. What does the EBITDA metric indicate?

                              EBITDA (Earnings Before Interest, Taxes, Depreciation, and Amortization) measures a company’s operational profitability and provides insights into its cash flow.

                            Understanding the Basics of IPOs

                            What is an Initial Public Offering (IPO)?

                            An Initial Public Offering (IPO) is a transformative financial event where a private company offers shares of its stock to the general public for the first time. This process allows the company to transition from private to public ownership, broadening its access to capital markets. 

                            IPOs are a crucial milestone for businesses aiming for long-term growth and sustainability. For investors and companies alike, understanding the nuances of IPOs is essential, and tools like stock market advisory services provide valuable insights. Additionally, exploring the complete IPO list can help investors stay updated on available opportunities, including upcoming IPOs in India and current new IPOs.

                            Why Companies Choose to Go Public

                            Companies opt to go public for a variety of reasons, including:

                            Capital Raising

                            • IPOs enable companies to secure substantial funds, often used for expansion, R&D, or paying off debts.

                            Market Visibility

                            • Public companies gain credibility and recognition, enhancing their brand reputation.

                            Liquidity for Existing Stakeholders

                            • Founders, employees, and early investors can liquidate their holdings post-IPO.

                            Access to Future Financing

                            • Being publicly listed allows access to additional funds through subsequent offerings.

                            Employee Benefits:

                            • Public companies can offer stock options, making them attractive to top talent.

                            Overview of IPO Types

                            Different Types of IPO Offerings Explained
                            IPOs are not a one-size-fits-all event. Different types of IPO cater to varying needs of companies and investors. These include fixed-price IPOs, book-building IPOs, offer-for-sale (OFS) IPOs, direct listings, and SMEs. Each type of IPO has distinct processes, advantages, and drawbacks.

                            How Each IPO Type Caters to Different Investor Needs

                            Fixed Price IPOs

                            • Best suited for retail investors who prefer price certainty and simplicity.

                            Book-Building IPOs

                            • Appeals to institutional investors seeking market-driven pricing.

                            OFS IPOs

                            • Designed for existing shareholders to liquidate their holdings without diluting equity.

                            Direct Listings

                            • Favored by well-established companies, avoiding underwriting costs.

                            SME IPOs

                            • Tailored for smaller enterprises looking to access public funding efficiently.

                            Main Types of IPO Issues

                            Fixed Price IPO

                            What is a Fixed-price IPO?

                            • A Fixed Price IPO sets a pre-determined price for shares before the IPO opens. Investors know exactly how much they will pay for each share when subscribing.

                            How Fixed Price IPOs Work

                            • The company, in consultation with underwriters, fixes a price for the shares.
                            • The price is based on the company’s valuation, market potential, and financial performance.
                            • Investors subscribe to shares at this fixed price; allotment is made based on demand.

                            Pros and Cons of Fixed Price IPOs

                            • Pros: Simplicity, predictable pricing, and easy understanding for retail investors.
                            • Cons: Lack of price flexibility, risk of underpricing or overpricing, and potential for oversubscription issues.

                            Book-Building IPO

                            What is a Book-Building IPO?

                            • A Book-Building IPO involves setting a price range (e.g., $100-$120 per share) rather than a fixed price. Investors bid within this range, indicating the number of shares they are willing to buy and at what price.

                            Process of Book-Building IPOs

                            • The company and underwriters determine a price band based on market conditions.
                            • Investors submit bids specifying the quantity of shares and their bid price within the range.
                            • Once the bidding period closes, the final price is determined based on demand.
                            • Shares are allocated to investors, often prioritizing higher bids.

                            Advantages of Book-Building Over Fixed Price

                            • Price determination is market-driven, ensuring better alignment with demand.
                            • Greater transparency in gauging investor interest.
                            • Higher chances of fair pricing, minimizing underpricing or overpricing risks.

                            Other Types of IPOs

                            Offer for Sale (OFS) IPO

                            Definition and Purpose of Offer for Sale

                            • In an OFS IPO, existing shareholders, such as promoters, venture capitalists, or private equity firms, sell their shares to the public. The proceeds from the sale go directly to these shareholders rather than the company.

                            How It Differs From Regular IPOs

                            • Unlike traditional IPOs, an OFS does not involve issuing new shares. It is purely a mechanism for existing stakeholders to exit or reduce their holdings.

                            Direct Listing IPO

                            What is a Direct Listing?

                            • Direct Listing bypasses traditional IPO processes like underwriting. Instead, the company lists its existing shares directly on a stock exchange, allowing them to be traded publicly.

                            When and Why Companies Use Direct Listings

                            • Direct Listings are ideal for companies with significant brand recognition and financial stability. They avoid underwriting fees, reduce dilution, and allow market forces to determine the share price.

                            SME IPO

                            What is an SME IPO?

                            • An SME IPO is a specialized public offering tailored for small and medium-sized enterprises. These IPOs are conducted on SME platforms of stock exchanges, like the NSE Emerge and BSE SME.

                            Eligibility Criteria for Small and Medium Enterprises

                            • Minimum post-issue paid-up capital of ₹1 crore.
                            • A strong operational track record.
                            • Compliance with regulatory norms and financial disclosures.

                            Benefits and Risks of SME IPOs

                            • Benefits: Access to growth capital, increased market visibility, and credibility.
                            • Risks: Higher volatility, limited investor participation, and potential liquidity challenges.

                            Factors Influencing IPO Type Selection

                            Company Goals and Funding Requirements

                            • Companies choose their IPO type based on strategic objectives such as growth, liquidity, or market positioning.

                            Market Conditions and Investor Sentiment

                            • Favorable market conditions encourage companies to opt for flexible pricing mechanisms like Book-Building IPOs.

                            Regulatory Guidelines and Compliance

                            • Regulatory requirements often dictate the IPO type, ensuring transparency and investor protection.

                            How to Choose the Right IPO as an Investor

                            Assessing the Type of IPO Issue

                            Understand the structure and pricing mechanism of the IPO to evaluate its suitability for your investment goals. Evaluating the types of IPO issues helps in aligning your financial strategies effectively.

                            Evaluating Risk and Return Based on IPO Type

                            Analyze the company’s financial health, growth potential, and market conditions to assess the risk-return tradeoff. Different types of IPO offer varying risk profiles, so aligning with your goals is crucial.

                            Matching Your Investment Strategy to the IPO Type

                            Align your portfolio objectives with the specific features of the IPO, whether it’s Fixed Price, Book-Building, or an SME IPO. Knowing the types of IPOs ensures better investment outcomes.

                            How Equentis Helps You Navigate IPO Types

                            Expert Analysis of Fixed Price and Book-Building IPOs


                            Equentis provides detailed insights into pricing mechanisms and demand trends to help you make informed decisions about different types of IPO.

                            Real-Time Tracking

                            Equentis’s tools allow you to monitor IPOs in real-time, ensuring you never miss out on lucrative opportunities in various types of IPO offerings.

                            Conclusion

                            Understanding the various types of IPOs is essential for making informed investment decisions. By evaluating each IPO type’s unique features, risks, and benefits, investors can align their strategies with their financial goals and market expectations. Knowing the types of initial public offering, from Fixed Price to SME, empowers investors with the knowledge needed to navigate these opportunities.

                            Related Posts

                            Mid-cap companies are critical in bridging the gap between small-scale and large corporations. These firms often showcase high growth potential while maintaining financial stability. According to the Securities and Exchange Board of India (SEBI), mid-cap stocks are those that are ranked from 101st to 250th in terms of full market capitalization. Investors looking for insights can explore share market advisory services for detailed guidance.

                            Below, we look closely at ten standout mid-cap companies from the Nifty Midcap 100 based on their financial metrics and charting higher per their market cap. If these companies continue to grow, they may become large-cap companies. 

                            For those evaluating options, a stock screener is a useful tool. Additionally, some mid cap stocks that could be large cap are worth exploring. Comprehensive details about mid cap stocks can further assist in making informed decisions.

                            Hindustan Zinc

                            MetricValue
                            CMP (Rs)438.00
                            P/E Ratio21.01
                            Market Cap (Rs Cr)184902.33
                            Dividend Yield (%)6.63
                            Net Profit (Q2 FY25, Rs Cr)2298.00
                            Quarterly Profit Variation (%)35.80
                            Sales (Q2 FY25, Rs Cr)8242.00
                            Quarterly Sales Variation (%)21.35
                            ROCE (%)46.25
                            Source: Screener.in (09-01-2025)

                            Hindustan Zinc is one of the prominent mid cap stocks in the Indian market. Its strong financial foundation represents a reliable option among mid market cap stocks. Its quarterly performance reflects robust growth. Hindustan Zinc has a current market price of Rs. 438.00 and a price-to-earnings (P/E) ratio of 21.01. 

                            With a market capitalization of Rs. 1,84,902.33 crore, the company boasts a dividend yield of 6.63%, making it notable for consistent returns. In the Q2 FY25, Hindustan Zinc recorded a net profit of Rs. 2,298.00 crore, representing a 35.80% increase in profit compared to the previous quarter. Its quarterly sales stood at Rs. 8,242.00 crore, with a sales growth of 21.35%. The company’s return on capital employed (ROCE) is an impressive 46.25%, showcasing its operational efficiency.

                            Max Healthcare

                            MetricValue
                            CMP (Rs)1206.30
                            P/E Ratio110.80
                            Market Cap (Rs Cr)117336.56
                            Dividend Yield (%)0.12
                            Net Profit (Q2 FY25, Rs Cr)281.81
                            Quarterly Profit Variation (%)1.85
                            Sales (Q2 FY25, Rs Cr)1707.46
                            Quarterly Sales Variation (%)25.26
                            ROCE (%)16.00
                            Source: Screener.in (09-01-2025)

                            Max Healthcare, another strong contender in the mid cap stocks segment, has shown consistent growth in its financial metrics. Its market performance places it among the top mid market cap stocks in the healthcare industry. Max Healthcare has a market price of Rs. 1206.30 and a P/E ratio of 110.80, with a market capitalization of Rs. 1,17,336.56 crore. 

                            The company’s dividend yield is relatively low at 0.12%. It reported a net profit of Rs. 281.81 crore in the latest quarter. The profit growth for the quarter was modest at 1.85%, while sales amounted to Rs. 1,707.46 crore, reflecting a sales growth of 25.26%. The return on capital employed (ROCE) for Max Healthcare stands at 16.00%.

                            Indian Hotels Company

                            MetricValue
                            CMP (Rs)822.80
                            P/E Ratio81.81
                            Market Cap (Rs Cr)117112.99
                            Dividend Yield (%)0.21
                            Net Profit (Q2 FY25, Rs Cr)582.71
                            Quarterly Profit Variation (%)87.82
                            Sales (Q2 FY25, Rs Cr)1826.12
                            Quarterly Sales Variation (%)27.42
                            ROCE (%)15.11
                            Source: Screener.in (09-01-2025)

                            Indian Hotels Company is a prominent name among mid cap stocks in the hospitality sector. It consistently performs well and is a key player in the mid market cap stocks category. Indian Hotels Company has a market price of Rs. 822.80 and a P/E ratio of 81.81, with a market capitalization of Rs. 1,17,112.99 crore. The company reported a net profit of Rs. 582.71 crore in the Q2 FY25, an increase of 87.82% compared to the previous quarter. Quarterly sales were recorded at Rs. 1,826.12 crore, marking a sales growth of 27.42%. The company’s return on capital employed (ROCE) is 15.11%.

                            Mankind Pharma

                            MetricValue
                            CMP (Rs)2828.05
                            P/E Ratio58.27
                            Market Cap (Rs Cr)116787.51
                            Dividend Yield (%)0.00
                            Net Profit (Q2 FY25, Rs Cr)634.43
                            Quarterly Profit Variation (%)34.84
                            Sales (Q2 FY25, Rs Cr)2529.74
                            Quarterly Sales Variation (%)11.91
                            ROCE (%)24.57
                            Source: Screener.in (09-01-2025)

                            As a leading pharmaceutical company, Mankind Pharma stands out among mid market cap stocks with its growth and performance. It continues to attract interest from those seeking dependable mid cap stocks. Mankind Pharma, with a market price of Rs. 2828.05 and a P/E ratio of 58.27, has a market capitalization of Rs. 1,16,787.51 crore. The company reported a quarterly net profit of Rs. 634.43 crore, reflecting a profit growth of 34.84%. Its sales for the quarter stood at Rs. 2,529.74 crore, with a sales growth of 11.91%. Mankind Pharma’s return on capital employed (ROCE) is 24.57%.

                            CG Power & Industrial Solutions

                            MetricValue
                            CMP (Rs)678.90
                            P/E Ratio116.03
                            Market Cap (Rs Cr)103906.14
                            Dividend Yield (%)0.19
                            Net Profit (Q2 FY25, Rs Cr)219.63
                            Quarterly Profit Variation (%)-1.77
                            Sales (Q2 FY25, Rs Cr)2412.69
                            Quarterly Sales Variation (%)20.54
                            ROCE (%)46.63
                            Source: Screener.in (09-01-2025)

                            CG Power & Industrial Solutions has consistently performed well among mid cap stocks, with steady financials that make it a prominent name in mid market cap stocks. CG Power & Industrial Solutions has a market price of Rs. 678.90 and a P/E ratio of 116.03, with a market capitalization of Rs. 1,03,906.14 crore. The company reported a quarterly net profit of Rs. 219.63 crore, though it saw a slight decline of 1.77% compared to the previous quarter. Its quarterly sales were Rs. 2,412.69 crore, representing a growth of 20.54%. The return on capital employed (ROCE) for CG Power is a remarkable 46.63%.

                            Lupin

                            MetricValue
                            CMP (Rs)2250.40
                            P/E Ratio39.09
                            Market Cap (Rs Cr)102659.62
                            Dividend Yield (%)0.36
                            Net Profit (Q2 FY25, Rs Cr)859.48
                            Quarterly Profit Variation (%)74.12
                            Sales (Q2 FY25, Rs Cr)5672.73
                            Quarterly Sales Variation (%)12.59
                            ROCE (%)15.72
                            Source: Screener.in (09-01-2025)

                            Lupin is a well-recognized name among mid market cap stocks in the pharmaceutical sector. Its growth trajectory places it among the top-performing mid cap stocks. Lupin has a current market price of Rs. 2250.40 and a P/E ratio of 39.09, with a market capitalization of Rs. 1,02,659.62 crore. The company reported a quarterly net profit of Rs. 859.48 crore, reflecting a growth of 74.12%. Quarterly sales were Rs. 5,672.73 crore, indicating a sales growth of 12.59%. Its return on capital employed (ROCE) stands at 15.72%.

                            Oracle Financial Services

                            MetricValue
                            CMP (Rs)11719.75
                            P/E Ratio40.76
                            Market Cap (Rs Cr)101715.50
                            Dividend Yield (%)2.05
                            Net Profit (Q2 FY25, Rs Cr)577.70
                            Quarterly Profit Variation (%)38.39
                            Sales (Q2 FY25, Rs Cr)1673.90
                            Quarterly Sales Variation (%)15.88
                            ROCE (%)39.54
                            Source: Screener.in (09-01-2025)

                            Oracle Financial Services is a standout performer among mid market cap stocks in the IT sector. Its financial performance continues to make it a favorite in mid cap stocks. Oracle Financial Services has a market price of Rs. 11,719.75 and a P/E ratio of 40.76, with a market capitalization of Rs. 1,01,715.50 crore. The company reported a quarterly net profit of Rs. 577.70 crore, showcasing a profit growth of 38.39%. Its quarterly sales stood at Rs. 1,673.90 crore, reflecting a growth of 15.88%. Oracle’s return on capital employed (ROCE) is a strong 39.54%.

                            Polycab India

                            MetricValue
                            CMP (Rs)6764.00
                            P/E Ratio56.60
                            Market Cap (Rs Cr)101573.95
                            Dividend Yield (%)0.44
                            Net Profit (Q2 FY25, Rs Cr)445.21
                            Quarterly Profit Variation (%)3.35
                            Sales (Q2 FY25, Rs Cr)5498.42
                            Quarterly Sales Variation (%)30.37
                            ROCE (%)31.33
                            Source: Screener.in (09-01-2025)

                            Polycab India consistently delivers excellent results, cementing its place among mid cap stocks. It remains a leader in mid market cap stocks for the electrical and industrial products sector. Polycab India has a market price of Rs. 6764.00 and a P/E ratio of 56.60, with a market capitalization of Rs. 1,01,573.95 crore. It reported a net profit of Rs. 445.21 crore in Q2 FY25, with a modest profit growth of 3.35%. Its quarterly sales stood at Rs. 5,498.42 crore, reflecting a growth of 30.37%. The return on capital employed (ROCE) is 31.33%.

                            Dixon Technologies

                            MetricValue
                            CMP (Rs)16835.05
                            P/E Ratio180.38
                            Market Cap (Rs Cr)101126.02
                            Dividend Yield (%)0.03
                            Net Profit (Q2 FY25, Rs Cr)411.70
                            Quarterly Profit Variation (%)119.30
                            Sales (Q2 FY25, Rs Cr)11534.08
                            Quarterly Sales Variation (%)133.33
                            ROCE (%)29.16
                            Source: Screener.in (09-01-2025)

                            Dixon Technologies is a major player in mid cap stocks, particularly in electronics manufacturing. Its remarkable growth secures its position among mid market cap stocks. Dixon Technologies, with a market price of Rs. 16,835.05 and a P/E ratio of 180.38, has a market capitalization of Rs. 1,01,126.02 crore. The company reported a net profit of Rs. 411.70 crore, reflecting a remarkable growth of 119.30%. Quarterly sales were Rs. 11,534.08 crore, showcasing a growth of 133.33%. Its return on capital employed (ROCE) is 29.16%.

                            Persistent Systems

                            MetricValue
                            CMP (Rs)6162.40
                            P/E Ratio77.80
                            Market Cap (Rs Cr)95914.77
                            Dividend Yield (%)0.42
                            Net Profit (Q2 FY25, Rs Cr)325.00
                            Quarterly Profit Variation (%)23.45
                            Sales (Q2 FY25, Rs Cr)2897.15
                            Quarterly Sales Variation (%)20.13
                            ROCE (%)29.17
                            Source: Screener.in (09-01-2025)

                            Persistent Systems is a leading name in mid cap stocks within the IT sector. It also ranks highly among mid market cap stocks due to its financial performance and market presence. Persistent Systems has a market price of Rs. 6162.40 and a P/E ratio of 77.80, with a market capitalization of Rs. 95,914.77 crore. The company reported a quarterly net profit of Rs. 325.00 crore, reflecting a growth of 23.45%. Its quarterly sales stood at Rs. 2,897.15 crore, indicating a growth of 20.13%. Persistent Systems has a return on capital employed (ROCE) of 29.17%.

                            Conclusion

                            The financial metrics of these ten mid cap stocks showcase their growth potential and stability across various sectors. As significant players in the mid market cap stocks category, they highlight the dynamism and opportunities that may be available in this segment.

                            Related Posts

                            FAQ

                            1.  What are mid cap stocks?

                              According to the Securities and Exchange Board of India (SEBI), mid-cap stocks are ranked from 101st to 250th in terms of full market capitalization.

                            2. What is the significance of mid market cap stocks?

                              Mid market cap stocks represent neither small nor large companies, offering balanced risk and reward for investors. They are often growth-oriented and expanding rapidly.

                            3. Why invest in mid cap stocks?

                              Investing in mid cap stocks allows investors to tap into companies with significant growth potential. These stocks often outperform in favorable market conditions.

                            4. How do mid market cap stocks perform in volatile markets?

                              Mid market cap stocks can be more volatile than large-cap stocks but tend to offer better returns during bull markets. However, they may be riskier during downturns.

                            As we enter 2025, the global and Indian economies are poised for significant transformations. Investors are keen to identify high-growth sectors. Whether you are a seasoned trader or a newbie looking to park your money in high-growth stocks, understanding these emerging opportunities is critical. 

                            Let’s explore the top five high-growth sectors in India set to dominate the year and why they could deliver multibagger stocks for your portfolio.

                              Infrastructure Development: The Backbone of Growth

                              Infrastructure continues to be one of India’s high-growth sectors. The government’s increased focus on urbanization, smart cities, and connectivity projects drives significant investment in this sector. With substantial budget allocations for road, rail, and metro projects, this sector may thrive in 2025.

                              The Union Budget 2024 allocated ₹11.11 lakh crore to the infrastructure sector, and estimates suggest this could increase to ₹18 lakh crore in Budget 2025. This funding boost aims to drive GDP growth and support India’s development through stronger public-private partnerships.

                              Source: Economic Times

                              Why Infrastructure?

                              • Strong Government Support: Policies like the Gati Shakti initiative and the National Infrastructure Pipeline (NIP) inject massive capital into this sector.
                              • Multiplier Effect: Infrastructure spending has a cascading impact on other industries, such as cement, steel, and real estate, creating a ripple effect in the economy.

                              Key Stocks to Watch

                              For investors, companies in construction, cement, and allied industries may offer potential high-return stocks. Consulting a stock market advisory could help pinpoint investments in this expanding field.

                                Electric Vehicles (EVs): Steering into the Future

                                The EV sector is undoubtedly one of the most disruptive high-growth sectors globally, and India is no exception. With growing environmental concerns and government incentives, EV adoption is expected to accelerate dramatically in 2025.

                                Why EVs?

                                • Policy Support: Subsidies under schemes like FAME-II and tax benefits on EV purchases are pushing adoption rates.
                                • Technological Innovation: Advances in battery technology and the establishment of charging infrastructure are creating a robust ecosystem for EVs.

                                Investment Opportunities

                                Top players in EV manufacturing, battery production, and charging infrastructure may deliver substantial growth. This sector’s growth trajectory can offer excellent opportunities for those looking for high-return stocks.

                                Electronics Manufacturing Services (EMS): Riding the “Make in India” Wave

                                The EMS sector is emerging as a critical pillar of India’s economic strategy. As global companies look to diversify supply chains away from China, India is becoming a key player in electronics manufacturing.

                                The production of consumer electronics, particularly mobile phones, is set to witness substantial growth in the coming years. Mobile phones dominate the EMS sector, with India now ranking as the world’s second-largest manufacturer. In FY24, India’s mobile phone exports surged by over 40% year-on-year, reaching $15.6 billion. Source: Economic Times

                                Why EMS?

                                • Government Incentives: Production-linked incentive (PLI) electronics manufacturing schemes are attracting domestic and international companies.
                                • Expanding Market: With the rise of consumer electronics and IoT devices, the demand for EMS is skyrocketing.

                                Investors may consider stocks in electronics assembly, semiconductor components, and hardware manufacturing companies if they align with their financial goals. A stock market advisory can help identify high-growth stocks that align with your financial goals in this space.

                                Renewable Energy: Powering Sustainability

                                Renewable energy is not just a buzzword anymore; it’s a necessity. India’s commitment to achieving its climate goals under the Paris Agreement has placed renewable energy on the list of high-growth sectors in India.

                                India’s renewable energy capacity reached 205 GW in 2024, positioning the country on track to achieve its 500 GW target by 2030 ahead of major economies like China. Investments in the sector are projected to double to $32 billion by 2025.

                                Source: Economic Times

                                Why Renewable Energy?

                                • Global Push for Green Energy: Solar, wind, and hydropower are rapidly replacing conventional energy sources today.
                                • Cost Competitiveness: Declining solar panels and wind turbine costs make renewable energy projects economically viable.

                                Investment Potential

                                Companies involved in solar panel manufacturing, wind turbine production, and energy storage solutions will likely deliver multibagger stocks. Consulting with a stock market advisory could help you zero in on the best opportunities in this field.

                                Healthcare and Pharmaceuticals: Always in Demand

                                Even during global downturns, the healthcare and pharmaceutical sectors have consistently proven resilient. With advancements in biotech, telemedicine, and an aging population, this sector remains one of the top high-growth sectors in India.

                                The healthcare sector, valued at $372 billion in 2023, is projected to expand to $638 billion by 2025. Growth opportunities abound in healthcare infrastructure, telemedicine, AI-driven diagnostics, and innovative health solutions. Initiatives like Ayushman Bharat Yojana and rising awareness of health insurance products are set to drive the sector’s progress further.

                                Source: Economic Times

                                Why Healthcare?

                                • Innovation: Breakthroughs in personalized medicine and biotechnology are opening new revenue streams.
                                • Pandemic Lessons: The COVID-19 pandemic underscored the importance of robust healthcare systems, driving increased investment.

                                Companies in pharmaceuticals, healthcare services, and medical equipment manufacturing could be investment options if they align with your objectives. The sector’s stability and growth make it a favorite for investors seeking high-return stocks.

                                How to Invest in High-growth Sectors in India

                                Identifying high-growth stocks requires research, timing, and sometimes a little help. Here are some tips to make the most of these opportunities:

                                Follow Market Trends

                                Keep a close eye on emerging trends within high-growth sectors. Regularly reviewing updates from reputable sources can help you stay ahead.

                                Consult Experts

                                Engaging with a stock market advisory can provide valuable insights into the best investment options.

                                Diversify Your Portfolio

                                Spread your investments across different high growth sectors to mitigate risks and optimize returns. For instance, consider allocating funds to infrastructure and renewable energy to balance stability and innovation.

                                Watch for Multibagger Stocks

                                Seek companies with strong fundamentals, robust growth potential, and innovative business models. These are often the ones that evolve into multibagger stocks.

                                Conclusion

                                The year 2025 presents a plethora of opportunities across various high growth sectors. From infrastructure and EVs to healthcare and renewable energy, the potential for identifying high return stocks is immense. You can capitalize on these potential growth sectors by staying informed and consulting with a stock market advisory.

                                Remember, the key to successful investing lies in research, patience, and diversification. With the right strategy, you could be well on your way to discovering the next high-growth stocks and securing a bright financial future.

                                Related Posts

                                FAQ

                                1. What are high-growth sectors?

                                  High-growth sectors are industries experiencing rapid expansion and significant market opportunities. They often involve cutting-edge technologies, innovative business models, and strong demand.

                                2. Why is it important to identify high-growth sectors?

                                  Identifying high-growth sectors can provide valuable insights for investors, entrepreneurs, and professionals seeking career advancement. It allows individuals to capitalize on emerging trends and position themselves for success in the future.

                                3. What are the key drivers of growth in these sectors?

                                  Technological advancements, increasing consumer demand, government regulations, and global economic trends are major drivers of growth in these sectors.

                                4. What are the potential risks associated with investing in high-growth sectors?

                                  Investing in high-growth sectors can involve risks such as market volatility and intense competition. Thorough research and careful risk assessment are crucial.

                                On a day when most sectors on Dalal Street faced challenges, Indian IT stocks stood out by registering notable gains. Heavyweight companies such as Tata Consultancy Services (TCS), Wipro, Infosys, Tech Mahindra, and HCLTech significantly pushed the benchmark indices, especially after a substantial downturn in the previous session. This resilience prompts an important question: What factors drive the surge in IT stocks amid broader market volatility?

                                Current Performance of IT Stocks

                                As of yesterday, on 22nd January, the following movements were observed:

                                • TCS: Shares increased by 3.04%, reaching ₹4,158.45.
                                • Wipro: Experienced a 3.37% rise, trading at ₹308.40.
                                • Infosys: Saw a 3.11% uptick, with shares closing at ₹1,856.70.
                                • HCLTech: Rose by 1.43%, reaching ₹1,827.40.
                                • Tech Mahindra also traded higher, contributing to the positive trend in the IT sector.

                                These movements were reflected in the Nifty IT index, which rose over 2% and was the best-performing sectoral index of the day.

                                AD 4nXfBtCyP7Mp3BDSAfi04RN 4pXFmGChLS8 W6 hOonfshaJ8VgUnctzwv5y0NoRXtogW8G4xLZCFTQvBZejQWU AWnkG qwj4ebMzxxt81dYfQfc6Q6Rz2Id L9LqB BlvSBytq41A?key=s2D G Sc7FEkJ3JR2zgq 3l8
                                Source: NSE

                                Factors Contributing to the IT Stocks Rally

                                Several key elements have contributed to the robust performance of Indian IT stocks:

                                  Optimism Around AI Investments

                                  A significant rally driver was US President Donald Trump’s announcement of a private sector investment of up to $500 billion to fund artificial intelligence infrastructure. This optimism offset uncertainties related to his tariff policy, promoting stocks.

                                    Positive Global Cues

                                    The U.S. markets exhibited strength, with the Dow Jones Industrial Average ending 1.24% higher and the Nasdaq Composite rising 0.64%. This global optimism has a cascading effect on Indian IT stocks, given their significant exposure to U.S. markets.

                                      AD 4nXf6NkfbBYwFMcZ6WoUjdGiH9D Cqiqu bL68ZVDIA6W2HC1Z4p6XWjU3P77JCRLpkCsetDeBo Tt5eGAlqPQpnUkJQCPjIwAdHrG0bkSf dCcbEHoK4BIG49u0d1mnTf0U0hMrVZA?key=s2D G Sc7FEkJ3JR2zgq 3l8
                                      Source: NSE

                                        Robust Q3 Results

                                        Major IT firms like TCS, Infosys, and Wipro reported strong third-quarter earnings, surpassing market expectations. Infosys, which rose 3.2%, was the best-performing Sensex stock and the biggest contributor to index gains, followed closely by TCS.

                                          Rupee Depreciation

                                          The Indian rupee’s depreciation against the U.S. dollar has positively impacted IT companies. Since a significant portion of their revenue is earned in dollars, a weaker rupee translates to higher earnings when converted to the local currency.

                                            Market Sentiment and Analyst Outlook

                                            Analysts have maintained a positive outlook for the IT sector. Global brokerage firms have given ‘Buy’ ratings to several IT stocks, anticipating growth driven by AI and cloud computing investments. Source: Mint

                                              Market Overview

                                              Despite the rally in IT stocks, the broader market faced selling pressure. On Wednesday, the Sensex ended the session at 76,405, with a gain of 566 points (0.75%), while the Nifty 50 index closed at 23,155, with a gain of 131 points (0.6%). However, broader indices faced declines, with the Nifty Midcap100 falling 1.3% and the Nifty Smallcap100 dropping 1.6%.

                                              Market breadth remained weak, with 2,802 stocks declining and only 1,142 advancing on the BSE. The total market capitalisation of BSE-listed firms declined by ₹2.2 trillion to ₹422 trillion, with a total decline of ₹20.1 trillion so far this month.

                                              AD 4nXfp779uWcYxkFGdNcwDnInbtIOz llfWAy7Dwq 7 kuTL EeNDi IijOKskmdOAPbBmCZJ0tKYTSOcKCQgFbluIRP3wmxMbQfZSrutEF3WjV5StyDG0TGOV8wKkAtGKyEph1ho?key=s2D G Sc7FEkJ3JR2zgq 3l8
                                              Source: NSE

                                              Understanding the Dynamics: A Step-by-Step Breakdown

                                              To comprehend the surge in IT stocks amid market volatility, let’s dissect the contributing factors:

                                                Global Market Influence

                                                Indian IT companies have substantial exposure to global markets, particularly the U.S. Positive movements in U.S. indices often increase investor confidence in Indian IT stocks.

                                                  Corporate Earnings

                                                  Strong quarterly results indicate robust business performance and future growth potential, making these stocks attractive to investors.

                                                    Currency Fluctuations

                                                    A depreciating rupee benefits exporters like IT companies, as their dollar-denominated revenues yield higher returns when converted to rupees.

                                                      Policy Announcements

                                                      Government initiatives and private sector investments, such as the $500 billion AI infrastructure funding, boost investor confidence in long-term growth prospects.

                                                        Analyst Recommendations

                                                        Positive analyst reports and ‘Buy’ ratings can influence investor behavior, increasing demand and higher stock prices.

                                                          AD 4nXdQVDA39Wuhxtn23TZbyjpbD8XOVMYLz6I6r3PbHnN5ZGVf6uCKdExM6L7gcsDrb5mHO1ZiHgwgbvwj7ORBuDd7uY4zsLZrvTk49gpQdI66WjCFhOd9a4zgzjT9D5NywjhepJHc?key=s2D G Sc7FEkJ3JR2zgq 3l8
                                                          Source: NSE

                                                          Conclusion

                                                          The resilience of Indian IT stocks amid broader market volatility can be attributed to strong corporate earnings, favorable global market trends, currency advantages, and positive sentiment around AI investments. These factors collectively strengthen investor confidence, leading to the observed surge in IT stock prices. As the global economic landscape continues to evolve, the performance of these companies will remain a focal point for market participants.

                                                          Related Posts

                                                          The Growing Popularity of Angel Funds in India

                                                          India’s startup ecosystem has flourished, with over 100 unicorns and a cumulative valuation surpassing $340 billion (Source: NASSCOM). While venture capitalists and private equity firms dominate later-stage investments, such as Series B or C rounds, angel investors, often through AIFs, address startups’ funding needs in their early growth phase.

                                                          For instance, in FY 2022–23, angel fund investments saw a 30% year-on-year increase, focusing primarily on technology, healthcare, and fintech startups. These funds have become instrumental in fueling innovation and scaling operations during the challenging pre-Series A phase.

                                                          This article delves into the pros and cons of AIFs, particularly angel funds, and explores how companies can leverage the benefits of AIF for sustainable growth.

                                                          Pros of Angel Funds 

                                                          Access to High-Growth Potential Startups: AIFs curate investment opportunities, allowing angel investors to back high-potential startups. By pooling resources, investors gain exposure to a broader portfolio, minimizing individual risk while supporting innovation. Startups in sectors like AI, health tech, and clean energy have particularly benefited from this model.

                                                          Regulated Framework: SEBI regulations ensure that AIFs operate with transparency and accountability. These rules protect investor interests, prevent fraud, and streamline the investment process, which is especially vital for early-stage investments where risks are high.

                                                          Strategic Support Beyond Capital: Angel funds bring significant value to startups through mentorship, industry connections, and strategic advice. This guidance can be invaluable for startups refining their product-market fit or planning expansion. Many AIFs also facilitate knowledge-sharing platforms, connecting startups with domain experts.

                                                          Tax Incentives: Category I AIFs enjoy several tax benefits. Investments in early-stage startups often qualify for tax deductions under Section 80-IAC, and long-term capital gains taxes are generally favorable compared to other asset classes.

                                                          Thematic and Sectoral Specialization: Many angel funds are industry-specific, enabling investors to channel resources into areas of expertise or interest. For example, funds dedicated to green tech or healthcare innovation offer focused investment opportunities that align with profit motives and societal impact.

                                                          Enhanced Networking Opportunities: Investors in AIFs often gain access to a network of seasoned professionals, entrepreneurs, and other stakeholders, fostering collaborative opportunities and synergies within the ecosystem.

                                                          Cons of Angel Funds Through AIF

                                                          Illiquidity Concerns: Investments in AIFs are generally locked for 5–7 years, making it challenging for investors seeking shorter-term liquidity. This long lock-in period demands careful financial planning, as funds cannot be accessed on demand.

                                                          High Minimum Investment Threshold: SEBI mandates a minimum investment of INR 1 crore for AIFs, which excludes small investors. This high entry barrier limits participation to high-net-worth individuals (HNIs) and institutional investors, reducing accessibility.

                                                          Management and Performance Fees: AIFs typically charge management fees (1–2% of the committed capital) and a share of profits (known as carry), usually around 20%. These costs can significantly affect investor returns, especially if the fund performs moderately.

                                                          Startup Risks: Despite AIFs’ diversification, early-stage startups remain a high-risk investment class. Factors like market volatility, regulatory changes, or operational failures can lead to significant losses. Reports indicate that nearly 70% of startups fail to achieve profitability within their first five years.

                                                          Limited Control for Investors: Unlike direct investments, AIF investors typically have a limited say in the fund’s decision-making. The reliance on fund managers means that the success of an investment often hinges on their expertise and judgment.

                                                          Extended Time Horizon for Returns: While startups funded through AIFs may achieve exponential growth, the timeline for such returns is often uncertain. However, the potential for substantial gains can keep investors optimistic about their investments.

                                                          Regulatory and Compliance Costs: While stringent compliance requirements for AIFs benefit transparency, they can increase operational costs, which may indirectly reduce investors’ net returns.

                                                          Leveraging AIF Benefits for Pre-Series A Companies

                                                          Angel funds provide crucial capital for companies in the growth phase to strengthen operations, expand teams, and refine products before entering the Series A stage. The benefits of AIF extend beyond financial support as companies gain access to seasoned mentors and networks that can accelerate growth.

                                                          For example, several fintech startups in India have successfully utilized angel funds to build scalable solutions, eventually attracting substantial Series A investments from global VCs.

                                                          Conclusion

                                                          AIFs, particularly angel funds, have become indispensable to India’s entrepreneurial landscape. While they offer significant benefits, including access to capital and strategic mentorship, investors and startups must carefully weigh the risks and rewards.

                                                          As the startup ecosystem continues to evolve, the role of AIFs in bridging funding gaps and driving innovation will only grow, reinforcing their importance in the journey from ideation to industry disruption.

                                                          Related Posts

                                                          The financial scene in India is buzzing with changes, and one of the latest game-changers is SEBI’s introduction of Specialised Investment Funds (SIFs). SIFs are tailored investment options for savvy investors ready to explore advanced strategies and diverse asset classes.

                                                          This new asset class, between mutual funds and PMSes (Portfolio Management Services), will introduce Indian investors to various new investment products and strategies.

                                                          SEBI has set a minimum investment bar of ₹10 lakh for SIFs, making it clear that these funds are for those serious about investing. The available range of products now spans mutual fund schemes starting at ₹10, PMSes with a minimum investment of ₹50 lakh, and Alternative Investment Funds (AIFs) requiring at least ₹1 crore. Source: Moneycontrol

                                                          Let’s break down what SIFs are all about, why this move matters, and how it shakes up the investment world.

                                                          What Are Specialised Investment Funds (SIFs)?

                                                          SIFs are a new category of funds designed to offer advanced investment opportunities beyond traditional avenues like equity mutual funds or fixed deposits. 

                                                          SEBI’s new framework for SIFs exempts accredited investors (These investors are considered financially sophisticated and capable of handling higher-risk investments) from certain rules. Mutual funds can now offer investment strategies in open-ended, close-ended, and interval formats, catering to investors with varying risk levels and investment goals. 

                                                          SIFs allow investors to diversify their portfolios in a transparent structure. Launching new strategies will follow the same process as mutual funds, with clear details on subscriptions, redemptions, and fees in line with mutual fund regulations. Source: livemint

                                                          Key Features of SIFs

                                                          • Diversification of Asset Classes: SIFs expose asset classes typically inaccessible to retail investors, such as real estate, infrastructure, or private debt.
                                                          • Professional Management: SIFs are managed by experts with deep knowledge of specific sectors, ensuring informed investment decisions.
                                                          • Regulated Framework: SEBI’s oversight ensures transparency, safeguarding investors from potential malpractices.
                                                          • Customized Strategies: These funds often employ tailored strategies, including hedging and leverage, to optimize returns.

                                                          How SIFs Differ from Traditional Mutual Funds

                                                          While both SIFs and mutual funds pool resources from investors, their objectives and structures are distinct:

                                                          SEBI’s New Rules for Specialised Investment Funds (SIF)
                                                          FeatureSIFMF
                                                          StrategiesAdvancedStandard
                                                          StructureOpen, Close, or IntervalSame
                                                          Minimum Investment₹10 Lakh across all strategiesStarts from 100
                                                          Debt Instruments<20% per Issuer<10% per Issuer
                                                          Company Ownership<15% of Company<10% of Company
                                                          Equity Instruments<10% of corpus in a single companySame
                                                          REITs/InvITS<20%, per issuer <10%<10%, per issuer 5%
                                                          Distinct IdentitySeparate BuildingNA
                                                          Tax BenefitSameStandard, Eg, Equity Fund, STCG 20%, LTCG 12.5%
                                                          Source: LiveMint

                                                          Let’s look at the differences between SIFs and Mutual Funds.

                                                          • Investment Limits and Flexibility

                                                          With a minimum investment of ₹10 lakh, Specialised Investment Funds (SIFs) provide asset managers with more flexibility compared to traditional mutual fund schemes. SIFs allow up to 15% allocation in a single security, which is notably higher than the 10% limit set for mutual funds. For fixed-income strategies, exposure can reach 20% in a single issuer, potentially increasing this limit to 25% with board approval. However, the existing 10% limit for a single issuer remains for traditional fixed-income strategies.

                                                          • Expense Ratio and Fees

                                                          The cost structure for SIFs mirrors that of mutual funds. For example, equity funds can charge a maximum Total Expense Ratio (TER) of 2% for the first ₹250 crore. After that, the cost decreases incrementally—1.75% for the next ₹1,250 crore, 1.60% for amounts between ₹1,500 and 3,000 crore, and so on. Additional expenses can also be charged over the TER.

                                                          • Increased Investment Limits for REITs and INVITs

                                                          A significant change with SIFs is doubling permissible investment limits in Real Estate Investment Trusts (REITs) and Infrastructure Investment Trusts (INVITs) to 20%. This provides more flexibility in allocation and opens new avenues for diversification. In contrast, the limit for these investments in mutual funds is currently capped at 10%. Source: Moneycontrol

                                                          SEBI’s ₹10 Lakh Minimum Threshold: What It Means

                                                          The decision to set a minimum investment threshold of ₹10 lakh aims to ensure that only informed and financially capable investors participate in SIFs. Here’s why:

                                                          • Targeting Sophisticated Investors: SIFs involve complex strategies and high risks. A higher threshold ensures participants understand the risks and have sufficient financial backing.
                                                          • Mitigating Retail Participation Risks: By limiting access to high-net-worth individuals (HNIs) and institutional investors, SEBI protects less-informed retail investors from potential losses.
                                                          • Encouraging Long-term Investments: The substantial minimum investment promotes a long-term approach, discouraging speculative trading.

                                                          Advantages of Investing in SIFs

                                                          • Access to Advanced Strategies: Investors gain exposure to sophisticated strategies like arbitrage, hedging, and leverage, which are typically unavailable in traditional funds.
                                                          • Portfolio Diversification: SIFs allow investors to diversify across unconventional asset classes, reducing reliance on traditional equities and bonds.
                                                          • Potential for Higher Returns: With advanced strategies and exposure to high-growth sectors, SIFs offer the potential for superior long-term returns.
                                                          • Professional Expertise: Experienced fund managers with sector-specific knowledge oversee these funds, enhancing decision-making quality.

                                                          Risks Associated with SIFs

                                                          While SIFs offer lucrative opportunities, they come with their share of risks:

                                                          • High Entry Barrier: The ₹10 lakh threshold limits access to wealthy investors, excluding retail investors.
                                                          • Complex Strategies: Advanced strategies can be challenging to understand, requiring a high level of financial literacy.
                                                          • Market Volatility: Investments in REITs, InvITs, and private equity are subject to market fluctuations, making them inherently risky.
                                                          • Illiquidity: Many SIFs have lock-in periods or restrictions on premature exits, reducing flexibility.

                                                          SEBI’s Regulatory Framework for SIFs

                                                          SEBI’s regulatory approach aims to balance protecting investors and fostering market growth. Key regulations include clear disclosure requirements, where fund managers must outline investment objectives, strategies, and risk factors. 

                                                          Only qualified and experienced professionals with proven track records can also manage SIFs, ensuring credibility. Regular audits and transparency in reporting further ensure compliance, which helps build trust among investors.

                                                          How SIFs Fit into India’s Financial Ecosystem

                                                          The introduction of SIFs aligns with India’s evolving financial market:

                                                          1. Catering to HNIs and Institutional Investors: With rising wealth, demand for sophisticated investment products has increased among HNIs.
                                                          2. Boosting Alternative Investments: SIFs support sectors like infrastructure and real estate, which are crucial for economic growth.
                                                          3. Complementing Traditional Funds: SIFs provide an alternative for investors seeking diversification beyond conventional equity and debt funds.

                                                          Impact on Investors and Market Dynamics

                                                          The launch of SIFs is expected to offer several benefits. It will expand investment options by providing access to advanced strategies and unconventional asset classes. Additionally, the sophisticated nature of SIFs could attract global investors looking to tap into India’s growth potential. Moreover, the complexity of SIFs will likely boost financial literacy, encouraging the development of educational initiatives to help investors better understand these opportunities.

                                                          Expert Opinions on SIFs

                                                          Market experts believe SIFs hold significant potential. They encourage financial sophistication by pushing investors to grasp advanced financial concepts, promoting a culture of informed decision-making. Focusing on alternative assets and advanced strategies could spur innovation within India’s financial sector. 

                                                          However, the high entry barrier and complexity of SIFs may limit participation from retail investors, presenting challenges in inclusivity and broader investor engagement.

                                                          Who Should Invest in SIFs?

                                                          SIFs are best suited for:

                                                          1. High-Net-Worth Individuals (HNIs): Investors with substantial disposable income and a high-risk appetite.
                                                          2. Institutional Investors: Corporations, pension funds, and endowments seeking diversified portfolios.
                                                          3. Sophisticated Retail Investors: Individuals with a strong understanding of financial markets and advanced investment strategies.

                                                          Conclusion

                                                          SEBI’s Introduction of Specialised Investment Funds (SIFs) is a milestone in India’s financial market evolution. While the ₹10 lakh minimum threshold ensures participation by informed investors, it also highlights the need for enhanced financial literacy. SIFs promise diversification, professional management, and the potential for high returns, making them a valuable addition to the investment landscape. However, their complexity and high-risk nature necessitate caution and thorough understanding.

                                                          FAQs

                                                          1. Will SIFs help investors?

                                                            Experts believe the SIF framework allows portfolio managers to create innovative, tailored products with broader exposure limits, enabling investors to pursue strategies that align with their risk profiles and financial goals.SIFs offer unique opportunities not found in mutual funds, particularly in concentration and thematic approaches, as well as credits. 

                                                          2. Can SIFs use derivatives in their investment strategy?

                                                            Currently, mutual funds are restricted from using derivatives for investment, allowing them only for hedging and portfolio rebalancing. Earlier this year, SEBI proposed allowing SIFs to use derivatives as an investment strategy. However, the final framework remains unclear, which is crucial for modern portfolio management.

                                                          3. What are the potential benefits?

                                                            Access to innovative sectors, potential for significant capital appreciation, diversification beyond traditional asset classes, and professional management.

                                                          4. What are the associated risks?

                                                            In some cases, there is higher volatility, illiquidity, potential for significant capital loss, and limited transparency.

                                                          5. How can I invest in these funds?

                                                            Through financial advisors, investment platforms specializing in alternative investments, or direct with fund managers.

                                                          If you’re interested in the stock market or companies specializing in water solutions and infrastructure development, you might want to learn more about Denta Water and Infra Solutions Ltd’s IPO. As it opens today for subscription, the issue size of ₹220.50 crore has generated significant interest among investors.

                                                          Yesterday, it announced that it had secured slightly more than ₹66 crore from anchor investors before its IPO. Here’s a detailed breakdown of everything you need to know about this IPO.

                                                          IPO Details of Denta Water and Infra

                                                          Offer Price₹279 to ₹294 per share
                                                          Face Value₹10 per share
                                                          Opening Date22 January 2025
                                                          Closing Date24 January 2025
                                                          Total Issue Size (in Shares)75,00,000
                                                          Total Issue Size (in ₹)₹220.50 Cr
                                                          Issue Type Book Built Issue IPO
                                                          Lot Size50 Shares
                                                          Listing atBSE, NSE
                                                          Source: SEBI

                                                          Denta Water and Infra Solutions Ltd is launching an IPO worth ₹220.50 crore, consisting of a fresh issuance of 75 lakh equity shares priced at the upper band of ₹294 per share. The shares will be listed on both the BSE and NSE, with the allotment expected to be finalized on Monday, January 27, 2025, and a tentative listing date set for Wednesday, January 29, 2025.

                                                          Allocation of Shares

                                                          Retail investors can apply for a minimum of 50 shares of Denta Water and Infra IPO, requiring an investment of ₹14,700, with a maximum limit of 650 shares, amounting to ₹1,91,100. Small High-Net-Worth Individuals (S-HNIs) can invest a minimum of 700 shares for ₹2,05,800, with a cap of 3,400 shares, amounting to ₹9,99,600. Large High-Net-Worth Individuals (B-HNIs) have a minimum investment of 3,450 shares, requiring ₹10,14,300.

                                                          ApplicationLotsSharesAmount
                                                          Retail (Min)150₹14,700
                                                          Retail (Max)13650₹1,91,100
                                                          S-HNI (Min)14700₹2,05,800
                                                          S-HNI (Max)683,400₹9,99,600
                                                          B-HNI (Min)693,450₹10,14,300
                                                          Source: SEBI

                                                          Objectives of the Denta Water and Infra IPO

                                                          The net proceeds from the IPO will be utilized for the following purposes:

                                                          Working Capital Requirements: To fund the company’s operations and business expansion.

                                                          General Corporate Purposes: Utilization as per applicable laws for business growth and development.

                                                            Grey Market Premium (GMP)

                                                            The Denta Water IPO Grey Market Premium (GMP) currently stands at ₹165, indicating a strong demand. Based on the IPO price of ₹294, the estimated listing price is projected to be ₹459, reflecting a 56.12% premium. The positive GMP suggests strong investor confidence and potential for a solid listing. Source: Mint

                                                            Company Overview

                                                            Incorporated in 2016, Denta Water and Infra Solutions Ltd is a leading player in water and infrastructure solutions. The company specializes in designing, installing, and commissioning water management projects, focusing on groundwater recharge.

                                                            Key projects executed:

                                                            • Byrapura Project
                                                            • Hiremagaluru LIS
                                                            • KC Valley Project

                                                            These projects have significantly contributed to Bengaluru’s wastewater management and the Jal Jeevan Mission. The company owns 98 acres of agricultural land in Madikeri, Karnataka, where it cultivates coffee, pepper, and cardamom. Additionally, it operates a beach resort in Udupi, generating revenue through a facility management agreement.

                                                            Service Offerings:

                                                            • Preliminary investigations and reconnaissance
                                                            • Feasibility studies
                                                            • Planning and project formulation
                                                            • Field surveys and soil testing
                                                            • Design services
                                                            • Tender bidding consultancy
                                                            • Project management and construction supervision
                                                            • Operation and maintenance guidelines
                                                            • Engineering procurement consultancy
                                                            • Turnkey projects

                                                            As of November 30, 2024, the company has successfully executed 32 water management projects, comprising:

                                                            • 11 as the main contractor
                                                            • 1 in a joint venture
                                                            • 20 as a sub-contractor

                                                            Denta Water is also involved in infrastructure projects across railways and highways.

                                                            Financials:

                                                            Revenue for the period ending September 30, 2024, was recorded at ₹98.51 Cr., which is lower than the previous fiscal year’s figure of ₹241.84 Cr. as of March 31, 2024, but shows a steady upward trend when compared to ₹175.75 Cr. in March 2023 and ₹119.64 Cr. in March 2022. The company’s profitability has also seen an upward trajectory over the years. 

                                                            AD 4nXftxM2P47HK9YfcPW MCf4r3en8rBw68uyoO9c8AyCXjg8GvJ0Ki0ODhMEBFcmTp bmChxpk jezet7kkq0n0xqqNGHxidmlqPdA9Q6MYTl RjGfIpXKaOqdH0rFV3lF pjmlAk?key=kryK2Ou dHIeavaFnyW2BsL2
                                                            Source: SEBI

                                                            Profit after tax for the half-year ending September 30, 2024, reached ₹24.2 Cr., following ₹59.73 Cr. for the full year ending March 31, 2024, up from ₹50.11 Cr. in March 2023 and ₹38.34 Cr. in March 2022. Net worth has shown consistent growth, reaching ₹188.46 Cr. as of September 30, 2024, up from ₹164.26 Cr. in March 2024, ₹104.55 Cr. in March 2023, and ₹54.43 Cr. in March 2022.

                                                            AD 4nXdipvyFuhyyvIZnk2PhaOnkETqMDgtuq8utvJt YODioNUZVdJZAN lyiDvI2FFUcrGbA DTQq dcKjXVP0pECk0G ezL2oBipcbqZhpsvzaU3y73OIhyQ5eRqrj800mDbr IZP?key=kryK2Ou dHIeavaFnyW2BsL2
                                                            Source: SEBI

                                                            SWOT Analysis of Denta Water and Infra Solutions Ltd

                                                            STRENGTHSWEAKNESSES
                                                            Strong Backing: Supported by NTPC Limited, ensuring financial and operational reliability.

                                                            Large Portfolio: A diversified renewable energy portfolio of 14,696 MW across solar and wind projects.

                                                            Execution Expertise: Proven track record in large-scale renewable energy projects.
                                                            Sector Dependency: Heavily reliant on the renewable energy sector. It is making it vulnerable to sector-specific risks.

                                                            Revenue Concentration: A significant portion of revenue depends on key off-takers.
                                                            OPPORTUNITIESTHREATS
                                                            Rising Demand for Renewable Energy: With an increasing global focus on sustainable energy, the company is well-positioned to capitalize on the demand.

                                                            Government Support: Strong government push towards renewable energy adoption and infrastructure development.
                                                            Market Competition: Intense rivalry from established and emerging players in the renewable energy space.

                                                            Regulatory Risks: Changes in government policies or tariffs could impact revenue streams.

                                                            Denta Water and Infra Solutions Ltd’s IPO India’s growing water infrastructure sector. The company is poised for growth with a solid track record, diversified business model, and promising financial performance. However, investors should consider the company’s dependence on government projects and working capital requirements before investing.

                                                            The IPO allotment results are expected on January 27, 2025, and the shares will tentatively list on January 29, 2025, on both the BSE and NSE. Stay tuned for further updates and market trends to make an informed investment decision.

                                                            Introduction

                                                            Republic Day, celebrated on January 26th, marks the adoption of India’s Constitution in 1950. It’s a day of pride, filled with grand parades on Kartavyapath, showcasing the nation’s journey and achievements. While many are glued to their TVs to watch this celebration, others focus on a different kind of screen—the stock market.

                                                            Even though Republic Day is a stock market holiday, its influence on trends can’t be ignored. Market movements before and after the holiday might reveal short-term changes. Understanding these shifts can help investors make informed decisions and manage their portfolios better. 

                                                            Let’s explore these stock market Republic Day trends and how these trends lead to changes in trending sector stocks.

                                                            Changing Trend in NIFTY50

                                                            YearPrice Level One Week Before (Rs.)Price Level One Week After (Rs.)% Change
                                                            201810,741.5510,666.55-0.70%
                                                            201910,886.8010,934.350.44%
                                                            202012,343.3012,089.15-2.06%
                                                            202114,433.7014,924.253.40%
                                                            202218,308.1017,516.30-4.32%
                                                            202317,894.8517,854.05-0.23%
                                                            202422,097.4521,771.70-1.47%
                                                            Source: NSE

                                                            *One week before Republic Day entails the data as of 15th January with a one-day shift in case the 15th was a market holiday. Similarly, one week after the 26th shows the data as of 5th of February.

                                                            The NIFTY trend around Republic Day shows no consistent pattern, with movements influenced more by broader market dynamics than the event itself. In 2018, 2020, 2022, and 2024, the index experienced declines of 0.70%, 2.06%, 4.32%, and 1.47%, reflecting bearish sentiment during those years. 

                                                            On the other hand, 2019 and 2021 saw gains of 0.44% and 3.40%, respectively, indicating some bullish momentum. Meanwhile, 2023 saw a minor 0.23% decline, suggesting market stability. More significant drops, such as in 2020 and 2022, were likely due to external factors rather than Republic Day. 

                                                            Overall, the period does not show a predictable trend, emphasizing the need for investors to focus on broader economic and global cues instead of relying solely on this occasion for market predictions.

                                                            Changing Trend in BSE SENSEX

                                                            YearPrice Level One Week Before (Rs.)Price Level One Week After (Rs.)% Change
                                                            201834,843.5134,757.16-0.25%
                                                            201936,318.3336,616.810.82%
                                                            202041,872.7341,142.66-1.74%
                                                            202149,034.6750,731.633.46%
                                                            202261,308.9158,644.82-4.35%
                                                            202360,092.9760,841.881.25%
                                                            202473,327.9471,731.42-2.18%
                                                            Source: BSE

                                                            *One week before Republic Day entails the data as of 15th January with a one-day shift in case the 15th was a market holiday. Similarly, one week after the 26th shows the data as of 5th of February.

                                                            From 2018 to 2024, the SENSEX exhibited a varied pattern during the Republic Day period. There have been both positive and negative movements over the years. In 2019 and 2021, the index saw moderate increases of 0.82% and 3.46%, respectively, indicating some bullish trends. 

                                                            However, there were also notable declines, with the SENSEX dropping by 1.74% in 2020, 4.35% in 2022, and 2.18% in 2024, reflecting bearish phases. The year 2023 was a slight exception, with a 1.25% gain.

                                                            Overall, the SENSEX trend during Republic Day doesn’t follow a clear or consistent pattern. While some years showed positive movement, the declines in other years overshadowed them. This suggests that external factors like market conditions and investor sentiment play a much more significant role than the event itself. 

                                                            Overall Trends Of Share Market Republic Day

                                                            There isn’t a consistent trend around Republic Day in the stock market, with price movements varying yearly. The market does not display a clear pattern, whether gain or loss. However, on a broader scale, stock market holidays 2025, like Republic Day, do have an impact, influencing trading volumes, prices, and sentiment.

                                                              Impact on Trading Volume

                                                              Before the holiday, trading volume often surges as investors rush to complete transactions, either rebalancing their portfolios or making last-minute adjustments. This is followed by a drastic drop to zero on the holiday itself. When the market reopens, pent-up demand from the closure results in higher trading volumes as investors react to news and events during the break.

                                                                Effect on Stock Prices

                                                                Following the holiday, stock prices can experience volatility driven by speculative trading and risk management. When the market reopens, these stocks often see sharp price movements as investors adjust to new information and react to changes in sentiment during the closure.

                                                                  Influence on Market Sentiment

                                                                  Before the holidays, many investors adopt a cautious approach, reducing their activity to avoid exposure to unexpected market events. Speculative traders, however, may heighten activity by leveraging short-term price fluctuations, which can create increased volatility and shifts in market sentiment.

                                                                    Global Market Influence

                                                                    Global events during the stock market holidays can influence the Indian market once it reopens. Investors with international exposure may need to adjust their strategies based on developments abroad. Indian companies’ ADRs and GDRs traded internationally can offer early indications of market sentiment.

                                                                      Liquidity Management

                                                                      Lower trading volumes around holidays reduce liquidity, making it harder to execute large orders without impacting stock prices. Investors often adjust their cash positions to ensure they can manage liquidity once the market reopens, leading to more volatile price movements for larger trades.

                                                                      How To Invest During The Holiday Volatility?

                                                                      • Rebalance your portfolio to reduce exposure to volatile sectors and diversify your investments. Keep cash reserves for opportunities post-holiday and avoid overleveraging. If needed, consult a stock market advisor for perfectly aligned strategies.
                                                                      • Set stop-loss, trailing stop, and limit orders to manage potential losses and protect gains during market volatility. A stock screener can help you filter stocks that meet your criteria.
                                                                      • Use hedging strategies like put options, futures contracts, or inverse ETFs to protect against market declines.
                                                                      • Stay informed on global developments and upcoming announcements that may impact the market when it reopens.
                                                                      • Focus on high-confidence trades and exercise patience, avoiding impulsive decisions driven by market noise.
                                                                      • Use technical analysis to identify key support and resistance levels and track chart patterns for better investment decisions.

                                                                      While the stock market does not show consistent trends around Republic Day, the impact of holiday volatility cannot be ignored. Both domestic and global factors often affect trading volumes, stock prices, and sentiment. 

                                                                      As an investor, you should focus on diversifying your portfolios, using protective orders, and staying informed to manage risks. Strategies like hedging, patience, and consulting a stock market advisor can help mitigate potential losses and capitalize on opportunities during market uncertainty.

                                                                      Related Posts

                                                                      FAQs

                                                                      1. Is Republic Day a stock market holiday?

                                                                        Yes, the stock market does not operate on 26th January every year.

                                                                      2. Apart from the effects of the stock market Republic Day and other similar market holidays, what other external factors can affect stock prices?

                                                                        External factors, such as economic indicators, monetary policy, political events, corporate earnings, global market movements, natural disasters, oil prices, investor sentiment, supply chain disruptions, technological changes, global crises, and market liquidity, can significantly affect stock prices.

                                                                      3. What is the current price level of Nifty50 and BSE Sensex?

                                                                        As of 10th January 2025, the price level of the SENSEX is Rs.77,378.91, and that of the NIFTY50 is Rs.23,431.50.

                                                                      The Indian telecom giant Vodafone Idea made headlines recently as its share price surged by 17%, hitting the upper circuit limit on Monday, January 20, 2025. The surge was fueled by speculation of a possible AGR (Adjusted Gross Revenue) dues waiver, boosting optimism among investors and the market. Source: CNBCTV18

                                                                      However, the stock opened almost flat on Tuesday and dropped over 4% during morning trading. This came after the company issued a clarification late Monday, stating it had not received any communication from the government regarding an AGR dues waiver. Source: Mint 

                                                                      image 12
                                                                      Source: NSE/Moneycontrol

                                                                      On January 20, 2025, the stock exchange asked Vodafone Idea Ltd to clarify a media report titled “Vodafone Idea, Airtel shares in focus as govt plans AGR dues waiver.” In response, Vodafone Idea stated after market hours, referring to a January 18, 2025, article titled “In Big Relief to Telcos, Govt weighs over ₹1 lakh crore AGR dues waiver.”  Source: Mint

                                                                      What Triggered the Surge?

                                                                      Speculation about a possible AGR dues waiver by the Indian government fueled Vodafone Idea’s share price surge. AGR dues have been a significant challenge for telecom operators in India, with companies like Vodafone Idea struggling with substantial payment obligations. A possible relief or restructuring of these dues could significantly ease the financial burden on the company.

                                                                      According to a TRAI report, telecom operators’ gross revenue rose to ₹91,426 crore in the July–September 2024 Quarter, up 10.5% year-over-year, driven by tariff hikes. The government calculates levies based on adjusted gross revenue (AGR), which grew 13.11% year-over-year to ₹75,310 crore. Vodafone Idea’s AGR increased by 4.39%, from ₹7,507.65 crore to ₹7,836.98 crore.

                                                                      Possible AGR Relief Expected in Union Budget 2025

                                                                      Reports suggest that the government may announce relief measures for telecom companies as early as February 1, during the Union Budget 2025. The proposed relief includes a partial waiver of Adjusted Gross Revenue (AGR) dues, potentially reducing liabilities for Bharti Airtel and Vodafone Idea by ₹38,000 crore and ₹52,000 crore, respectively.

                                                                      The government is reportedly considering waiving penalties and interest components of AGR dues. This move comes after telecom operators, including Vodafone Idea and Bharti Airtel, sought relief following the Supreme Court’s September 2024 rejection of a curative plea to reassess AGR demands. Source: CNBCTV18

                                                                      AGR Dues Breakdown

                                                                      • Vodafone Idea: Estimated AGR dues of around ₹80,000 crore
                                                                      • Bharti Airtel: Estimated AGR dues of approximately ₹42,000 crore

                                                                      According to IIFL Securities, Vodafone Idea’s stock could see a short-term boost if the relief is announced. After the potential AGR waiver, The brokerage estimated a fair value of ₹10 per share for Vodafone Idea.

                                                                      Understanding AGR and Its Impact

                                                                      Adjusted Gross Revenue (AGR) refers to telecom operators’ revenue from telecom services. In 2019, the Supreme Court of India ruled that telecom companies must include non-core revenue in their AGR calculations, leading to massive liabilities for companies like Vodafone Idea.

                                                                      While the company has made partial payments, the outstanding amount remains substantial. This liability has weighed heavily on its financial health, affecting its ability to invest in network expansion and other critical areas.

                                                                      Why Is an AGR Waiver Crucial for Vodafone Idea?

                                                                      Vodafone Idea has been walking a tightrope, juggling massive debts, intense competition, and dwindling market share. Here’s why an AGR waiver could be a game-changer:

                                                                      Debt Reduction

                                                                      An AGR waiver would provide much-needed relief, reducing the debt burden and allowing Vodafone Idea to focus on operational improvements.

                                                                        Increased Investor Confidence

                                                                        Positive developments like an AGR waiver can restore investor confidence, attract fresh capital, and improve the company’s stock performance.

                                                                          Operational Stability:

                                                                          Reduced financial pressure would enable Vodafone Idea to invest in upgrading its network infrastructure, enhancing service quality, and competing more effectively with rivals.

                                                                            Market Reaction and Investor Sentiment

                                                                            The market’s response to the potential AGR waiver buzz was positive. Vodafone Idea’s stock hit the 17% upper circuit, reflecting strong investor interest. Trading volumes also spiked, indicating heightened activity and optimism among market participants.

                                                                            While the prospect of an AGR waiver is promising, its implementation remains uncertain. Investors are advised to exercise caution and monitor further developments closely.

                                                                            Challenges Ahead for Vodafone Idea

                                                                            Despite the positive momentum, Vodafone Idea faces several challenges that could impact its recovery:

                                                                            Stiff Competition:

                                                                            Reliance Jio and Bharti Airtel continue to dominate the telecom market, offering competitive pricing and superior service quality.

                                                                              Capital Requirements:

                                                                              Even with an AGR waiver, Vodafone Idea will need significant capital infusion to invest in 5G infrastructure and improve its network capabilities.

                                                                                Regulatory Hurdles

                                                                                The company’s future depends heavily on favorable regulatory decisions, including spectrum pricing and other policy measures.

                                                                                  Analysts Perspectives

                                                                                  While the recent surge in Vodafone Idea’s share price has grabbed attention, analysts remain divided on its long-term prospects. According to a CNBC TV18 report, some experts believe the stock’s fair value is below its Follow-on Public Offering (FPO) price, highlighting concerns about its financial stability and growth potential.

                                                                                  On the other hand, optimists argue that strategic initiatives, coupled with potential government support, could pave the way for a turnaround. The company’s ongoing efforts to raise funds through equity and debt are steps in the right direction.

                                                                                  What Lies Ahead?

                                                                                  The road ahead for Vodafone Idea is fraught with uncertainties, but there are reasons for cautious optimism:

                                                                                  Government Support:

                                                                                  • As evidenced by past relief measures, the government’s willingness to support the telecom sector bodes well for Vodafone Idea.

                                                                                  Fundraising Plans:

                                                                                  • The company’s efforts to secure fresh capital will be crucial in addressing its financial woes and funding future growth.

                                                                                  Strategic Partnerships:

                                                                                  • Collaborations with global technology and telecom players could provide the expertise and resources needed to strengthen Vodafone Idea’s position.

                                                                                  Conclusion

                                                                                  Vodafone Idea’s recent share price rally underscores the impact of positive market sentiment and speculation. While the potential AGR waiver buzz has reignited hope for the company’s revival, it’s essential to approach the situation with a balanced perspective. The telecom operator’s long-term success depends on favorable policy decisions, strategic initiatives, and robust execution.

                                                                                  Related Posts

                                                                                  Families can find it challenging to manage their finances during difficult times. To help, the Securities and Exchange Board of India (SEBI) has updated its nominee rules, making it easier for families to access and transfer assets when a loved one cannot manage them.

                                                                                  SEBI has introduced new guidelines to simplify the nomination process for mutual fund folios and demat accounts. These updated rules, effective from March 1, 2025, aim to make asset transfers easier, particularly in case of an investor’s illness or death. Source: CNBCTV18.com

                                                                                  Announced on January 10, these rules are designed to offer families a financial safety net. These new rules let nominees handle the accounts of physically incapacitated investors without needing a power of attorney (POA).  However, experts caution that there may still be some challenges and limitations. Source: Mint

                                                                                  Let’s dive into what these new nominee rules mean for investors and their families.

                                                                                  The Need for Revamping Nominee Rules

                                                                                  Streamlining Succession Processes
                                                                                  Previously, families often faced procedural delays and legal hurdles when accessing investments held by an incapacitated individual. This was primarily due to incomplete or unclear nominee designations, which could lead to disputes and complications.

                                                                                  Key Features of SEBI’s New Guidelines

                                                                                  Objective of the New RulesDesigned to assist mutual fund and demat account holders in managing investments during sudden illness or death.
                                                                                  Nominee AuthorizationSingle-holding investors can now authorize one nominee (excluding minors) to manage their accounts if they are physically incapacitated but mentally sound.
                                                                                  SEBI now requires all investors to choose a nominee or formally opt out by submitting a declaration.
                                                                                  Up to 10 Nominees AllowedSEBI has increased the number of nominees an investor can assign to their account or folio. Previously, the limit was three nominees, but now investors can nominate up to 10 individuals. Additionally, investors can edit or remove these nominations at any time.
                                                                                  Digitized and Simplified Process
                                                                                  Investors can register their nominees online, reducing paperwork and streamlining the process. This digital-first approach ensures accessibility and convenience for investors.
                                                                                  Comprehensive Disclosure Requirements
                                                                                  Investors must provide a PAN, driving license number, or the last four digits of their Aadhaar number. They must also share the nominee’s complete contact details, including address, email, phone number, relationship to the investor, and date of birth (if the nominee is a minor).
                                                                                  Asset Transmission ProcessOnly two documents are needed to transfer assets to registered nominees: a self-attested copy of the deceased investor’s death certificate and the nominee’s updated or reaffirmed KYC details.
                                                                                  SEBI has clarified that no extra paperwork, such as affidavits, indemnities, undertakings, or notarization, will be needed.
                                                                                  Regulations for Joint HoldingsFor joint accounts, SEBI requires clear instructions on the succession process. If no nominee is declared, the surviving account holder will take priority.
                                                                                  Restricted AccessNominees cannot update critical details like bank accounts or contact information.
                                                                                  Redemption ProceedsFunds from redemptions will be credited directly to the investor’s linked bank account.
                                                                                  ExclusionsThese guidelines do not cover investors in critical conditions, such as those in comas or on ventilators.
                                                                                  Source: Source: CNBCTV18.com | Mint | Business Standard

                                                                                  Concerns Raised by Experts

                                                                                  • Risk of Misuse: Nominees redeeming for incapacitated investors may misuse funds. Policing this activity poses significant challenges for SEBI, depository participants (DPs), and asset management companies (AMCs).
                                                                                  • Increased Complaints: There could be a rise in disputes filed through SEBI’s Complaint Redressal System (SCORES). Online dispute resolution (ODR) could become a necessary alternative.

                                                                                  Issues with Redemption Safeguards

                                                                                  • As per SEBI rules, redemption proceeds are credited to the investor’s linked bank account. If the nominee is a joint account holder, this safeguard offers limited protection against misuse.
                                                                                  • Banks require a power of attorney (POA) or specific mandates to allow nominees access to funds, per RBI guidelines.
                                                                                  • Discrepancies between SEBI and RBI rules can leave families without access to emergency funds.
                                                                                  • Source: Mint

                                                                                  Ambiguity in the Rules

                                                                                  The new circular addresses many concerns but does not address what happens if an investor becomes incapacitated and unable to make legal decisions. In such situations, the existing rules require a guardianship certificate from the courts, which can be complex and time-consuming. However, this requirement helps ensure the investor’s funds are safeguarded and not misused.

                                                                                  What Is Needed

                                                                                  Experts believe the issue will remain unresolved unless the RBI aligns its stance with SEBI. They suggest an aggregator regulator to bridge the gap between regulatory bodies like SEBI, RBI, IRDAI, PFRDA, CERT-In, and MeITY. They also urged the Ministry of Finance to form a Joint Parliamentary Committee (JPC) to recommend changes whenever laws are amended, ensuring better coordination and consistency.

                                                                                  Benefits for Families of the Incapacitated

                                                                                  Faster Access to Assets

                                                                                  • One of the most significant advantages of the new rules is the reduced time taken to access assets. By ensuring nominees are registered, and records are updated, families can bypass lengthy legal proceeding.s

                                                                                  Minimized Disputes

                                                                                  • The comprehensive disclosure requirements eliminate potential ambiguities, reducing the likelihood of disputes among family members or legal heirs.

                                                                                  Empowering Investors

                                                                                  • The process encourages investors to take a proactive role in estate planning. By designating nominees early, they can ensure their assets are transferred according to their wishes.

                                                                                  What Investors Should Know

                                                                                  While SEBI’s revamped rules offer numerous benefits, they also bring certain challenges that investors should be mindful of:

                                                                                  Ensuring Nominee Awareness


                                                                                  Investors need to inform their nominees about their roles and responsibilities. Without this communication, nominees may face difficulties when attempting to claim assets.

                                                                                  Regular Updates Are Crucial

                                                                                  Family dynamics can change over time due to events like marriage, divorce, or births. Investors should periodically review and update their nominee details to reflect these changes.

                                                                                  Potential for Overlooking Legal Heirs

                                                                                  While nominees are custodians of the assets, they may not always be the legal heirs. Investors should consider drafting a will to clarify their intentions and avoid conflicts.

                                                                                  How Financial Institutions Are Adapting

                                                                                  Enhanced Support for Investors

                                                                                  Banks, mutual fund companies, and brokerage firms are updating their processes to comply with SEBI’s guidelines. Many now offer online tools to help investors register and manage nominee details.

                                                                                  Educational Initiatives

                                                                                  Financial institutions are conducting workshops and webinars to spread awareness about the importance of nominee registration. These initiatives aim to empower investors with the knowledge to make informed decisions.

                                                                                  Case Study: A Family’s Journey with the New Rules

                                                                                  Let’s consider the story of Mr. Ramesh, a retired government employee. He invested in mutual funds and shares but had never nominated anyone. After suffering a stroke, his family struggled to access his investments. However, with SEBI’s revamped rules, they could quickly update his records and register his wife as the nominee. This allowed seamless access to his assets, providing financial stability during a challenging time.

                                                                                  Encouraging Financial Literacy

                                                                                  Promoting Proactive Estate Planning
                                                                                  SEBI’s rules remind investors of the importance of financial planning and promote a culture of preparedness by encouraging them to nominate beneficiaries.

                                                                                  Bridging Gaps in Awareness
                                                                                  Despite the availability of nominee registration, many investors remain unaware of its importance. SEBI’s efforts are a step towards closing this gap, ensuring more families are protected.

                                                                                  Making the Most of the New Rules

                                                                                  1. Act Early: Register a nominee as soon as you start investing. This ensures your family’s financial security in case of unforeseen events.
                                                                                  2. Keep Details Updated: Review and update nominee information regularly to reflect changes in family structure.
                                                                                  3. Communicate with Nominees: Inform your nominees about their designation and provide them with relevant documents.
                                                                                  4. Consider a Will: A will can complement nominee registration, providing additional clarity and legal backing.
                                                                                  5. Leverage Digital Tools: Use online platforms offered by financial institutions to simplify nominee registration and management.

                                                                                  Conclusion

                                                                                  SEBI’s revamped nominee rules are a significant step towards safeguarding the interests of investors and their families. These regulations ensure timely financial support for families during challenging times by simplifying the asset transfer process and reducing legal hurdles. However, the onus is on investors to proactively register nominees, stay informed, and regularly update their records. With these steps, they can ensure their loved ones are protected and supported when it matters the most.

                                                                                  Related Posts

                                                                                  FAQs

                                                                                  1. Can nominees manage accounts for incapacitated investors?

                                                                                    Yes. SEBI allows nominees to operate accounts if the investor is physically incapacitated but mentally capable. This ensures continued access to funds for essential needs. 

                                                                                  2. How do these rules simplify matters for families?

                                                                                    The rules streamline the process of accessing funds for the care and well-being of incapacitated family members. This reduces delays and bureaucratic hurdles, allowing families to focus on their loved one’s care. 

                                                                                  3. What if the incapacitated investor cannot make decisions?

                                                                                    In cases where the investor lacks mental capacity, the nominee’s role is limited. Legal avenues, such as guardianship or court orders, would be necessary to manage the account.

                                                                                  4. How can families ensure smooth access to funds?

                                                                                    Families should ensure clear nomination details are registered with the financial institution. It’s crucial to keep these details updated and understand the specific procedures for accessing funds in case of incapacity.

                                                                                  From an early age, we are taught that setting clear goals is essential for achieving success in life. It’s challenging to reach a destination if you don’t know where you are headed. Once you identify what truly matters to you, setting goals becomes a compass that keeps you focused and committed to achieving them.

                                                                                  When it comes to building an investment portfolio, it’s a powerful strategy for growing your wealth. However, it demands consistent oversight and informed decisions at every stage. If your current approach is not yielding the desired results, it might be time to rethink your strategy.

                                                                                  One effective approach is goal-based investing. This strategy keeps your financial objectives at the forefront, allowing you to manage your investments with a clear purpose and direction.

                                                                                  Consider a fitness journey as an example: setting a goal to run a marathon requires a detailed training plan, consistent effort, and adjustments along the way. Similarly, goal-based investing involves setting financial targets, crafting a plan to achieve them, and staying adaptable as circumstances evolve.

                                                                                  In this article, we will dive into the concept of goal-based investing, guide you on how to set financial goals, and demonstrate how this approach can significantly contribute to your wealth-building journey.

                                                                                  What is Goal-Based Investing?

                                                                                  Goal-based investing is a strategy that involves determining specific financial goals and selecting investments that align with those goals. Unlike traditional investing, which focuses purely on returns, goal-based investing takes a more holistic approach by focusing on meeting financial objectives such as retirement, buying a house, funding education, or creating an emergency fund.

                                                                                  The first step in goal-based investing is to identify and define your financial goals. This can include both short-term and long-term goals. Short-term goals might include saving for a vacation or building an emergency fund, while long-term goals could involve retirement planning or wealth accumulation for future generations. Once these goals are clear, the next step is to determine how much money is required to achieve them.

                                                                                  How Goal-Based Investing Helps in Wealth Creation?

                                                                                  Goal-based investing helps in wealth creation by guiding the investor toward a more structured and disciplined investment strategy. When you invest with a specific goal in mind, you can determine the best investment vehicles and risk levels based on the timeframe and the financial target you are aiming to meet. Here are the key ways goal-based investing helps:

                                                                                  • Clarity of Purpose: When you invest with a clear goal, you are more likely to remain focused and avoid impulsive decisions. You know exactly how much money you need, by when you need it, and how much risk you are willing to take.
                                                                                  • Strategic Allocation of Assets: Different goals require different investment strategies. For instance, retirement savings may need to be invested in equity markets, while short-term goals may require safer options like fixed deposits or debt funds. Goal-based investing allows for customised asset allocation.
                                                                                  • Time-Based Planning: With clear financial milestones, goal-based investing helps you determine how long you have to achieve each goal. This influences the risk you take on and the type of investments you make.
                                                                                  • Flexibility in Rebalancing: As your financial situation or goals change, goal-based investing allows you to periodically rebalance your portfolio to ensure it aligns with your evolving needs.

                                                                                  Steps to Implement Goal-Based Investing

                                                                                  To make goal-based investing effective for wealth creation, follow these key steps:

                                                                                  • Identify Your Goals: Whether it is buying a home, funding education, or saving for retirement, the first step is identifying what you are saving for and when you want to achieve it. This will guide your investment strategy and asset allocation.
                                                                                  • Set Specific, Measurable Targets: A goal like “I want to retire comfortably” is vague. Instead, set a specific target like “I want ₹1 crore by 2050 for retirement.” This gives you a concrete figure to work toward.
                                                                                  • Choose the Right Investment Options: Once you know your goal and target, you can select the right investment options. For long-term wealth creation, stocks, mutual funds, and ETFs might be ideal, whereas, for short-term goals, debt funds or fixed deposits may be more appropriate.
                                                                                  • Regularly Monitor and Adjust Your Strategy: Periodic reviews of your investments help ensure that you are on track to meet your goals. Adjustments may be necessary if your financial situation changes, or if you are not hitting the desired return targets.

                                                                                  How to Invest Your Monthly Surplus Savings?

                                                                                  An illustrating how to allocate savings across these options:

                                                                                  Emergency FundPlanning for unknown situations
                                                                                  SIPsEquity/Debt funds
                                                                                  FDsGuaranteed returns
                                                                                  Stock MarketDirect investments
                                                                                  Real EstateREITs or property
                                                                                  RetirementPPF/NPS
                                                                                  GoldDigital Gold/SGBs

                                                                                  In conclusion, investing your monthly surplus savings is a powerful step towards financial independence. By diversifying across multiple asset classes like mutual funds, fixed deposits, stocks, and gold, you can balance risk and reward effectively. Prioritise your financial goals and start small if needed—consistency and discipline will yield compounding benefits over time. Make your surplus savings work harder for you and secure a brighter future.

                                                                                  Related Posts

                                                                                  FAQ

                                                                                  1. How does goal-based investing differ from traditional investing?

                                                                                    Goal-based investing focuses on achieving specific financial objectives, while traditional investing aims to maximise returns or outperform the market. This personalised approach helps in aligning investments with individual life goals, offering more structured and meaningful results.

                                                                                  2. Can goal-based investing be applied to all types of investors?

                                                                                    Yes, goal-based investing is suitable for all types of investors, regardless of their financial situation or investment knowledge. Whether you are a beginner or an experienced investor, this approach can be tailored to meet your unique financial goals and timelines.

                                                                                  3. What are the key factors to consider when setting financial goals?

                                                                                    When setting financial goals, consider factors such as the time horizon, risk tolerance, expected returns, and the monetary value of each goal. It is also important to regularly review and adjust your goals based on changes in your financial situation or market conditions.

                                                                                  Are you among the many investors who bid for the Laxmi Dental IPO? If so, you’re not alone. The Laxmi Dental IPO has attracted unprecedented attention from investors across categories, leading to an oversubscription of 114 times. This response showcases the strong demand and investor confidence in the company’s prospects. 

                                                                                  However, with such high levels of interest, many are left wondering about the next steps. How will the allotment process work? What can investors expect on the listing day? And what role does the grey market premium (GMP) play in shaping expectations? We’ll break down each aspect step by step, helping you navigate through the allotment status, listing details, and market trends with ease.

                                                                                  Laxmi Dental IPO Subscription Details

                                                                                  The Laxmi Dental IPO opened for public subscription on January 13, 2025, and closed on January 15, 2025. It raised ₹698.06 crore, comprising a fresh issue of 32.24 lakh equity shares aggregating ₹138 crore and an offer for sale (OFS) of 1.31 crore shares worth ₹560.06 crore. The IPO price band was set between ₹407 and ₹428 per share.

                                                                                  Investor CategorySubscription (times)Shares OfferedSharesbid forTotal Amount ( Cr.)*
                                                                                  Anchor Investors173,39,39573,39,395314.13
                                                                                  Qualified Institutions110.3848,92,93154,00,81,36623,115.48
                                                                                  Non-Institutional Buyers147.6924,46,46436,13,21,15815,464.55
                                                                                  bNII (bids above ₹10L)167.6816,30,97627,34,89,21611,705.34
                                                                                  sNII (bids below ₹10L)107.78,15,4888,78,31,9423,759.21
                                                                                  Retail Investors75.116,30,97612,24,80,6885,242.17
                                                                                  Total114.1489,70,3711,02,38,83,21243,822.20
                                                                                  Source: Mint

                                                                                  The strong response on the final day highlights the high demand across all investor categories.
                                                                                  If you were to look at the day-wise subscription details:

                                                                                  DateQIBNIINII (> ₹10L)NII (< ₹10L)RetailTotal
                                                                                  Day 1Jan 13, 20250.1310.8910.5811.5212.615.33
                                                                                  Day 2Jan 14, 20250.8437.4439.3833.5729.6516.06
                                                                                  Day 3Jan 15, 2025110.38147.69167.68107.775.1114.14

                                                                                  Allotment Details

                                                                                  With bidding now closed, the focus shifts to allotment. Laxmi Dental is expected to finalise the basis of share allotment on Thursday, January 16, 2025. Here’s a step-by-step guide to checking the allotment status:

                                                                                  Laxmi Dental IPO Allotment Status on BSE

                                                                                  1. Visit BSE website on this link – BSE Allotment Status.
                                                                                  2. Select ‘Equity’ in the Issue Type.
                                                                                  3. Choose ‘Laxmi Dental Limited’ in the Issue Name dropdown menu.
                                                                                  4. Enter either Application No. or PAN.
                                                                                  5. Verify by ticking on ‘I am not robot’ and click on ‘Search’.

                                                                                  Your Laxmi Dental IPO allotment status will be displayed on the screen.

                                                                                  Laxmi Dental IPO Allotment Status on Link Intime

                                                                                  1. Visit IPO registrar website on this link – Link Intime Allotment Status.
                                                                                  2. Choose ‘Laxmi Dental Limited’ in the Select Company dropdown menu.
                                                                                  3. Select among PAN, App. No., DP ID, or Account No.
                                                                                  4. Enter the details as per the option selected.
                                                                                  5. Click on Search.

                                                                                  Your Laxmi Dental IPO allotment status will be displayed on the screen.

                                                                                  Alternatively, you can check allotment status on the BSE or NSE websites.

                                                                                  Key DatesEvent
                                                                                  January 16, 2025Allotment Finalisation
                                                                                  January 20, 2025IPO Listing on BSE & NSE
                                                                                  Source: Mint

                                                                                  Refunds and Credit of Shares

                                                                                  For those who do not receive an allotment, refunds will be initiated on the same day as the allotment finalization. Successful bidders will have their equity shares credited to their demat accounts promptly.

                                                                                  Grey Market Premium (GMP) Update

                                                                                  Laxmi Dental shares are already creating a buzz in the grey market. The current GMP stands at ₹127 per share, suggesting strong investor sentiment. Here’s what the numbers indicate:

                                                                                  • Issue Price: ₹428 per share
                                                                                  • GMP: ₹127 per share
                                                                                  • Estimated Listing Price: ₹555 per share
                                                                                  • Premium: 29%

                                                                                  This bullish trend signals optimism among unlisted market investors ahead of the official listing.
                                                                                  Source: Mint

                                                                                  Use of IPO Proceeds

                                                                                  According to the Red Herring Prospectus (RHP), the proceeds from the fresh issue will be allocated to:

                                                                                  • Debt Repayment: Reducing financial liabilities.
                                                                                  • Capital Expenditure: Supporting operational growth.
                                                                                  • Subsidiary Investment: Funding Bizdent Devices Pvt Ltd.
                                                                                  • General Corporate Expenses: Meeting miscellaneous costs.

                                                                                  Laxmi Dental, a fully integrated dental products company, offers a diverse portfolio ranging from tailor-made crowns and bridges to branded products such as aligner solutions and pediatric dental care items.

                                                                                  Steps to Prepare for the Listing Day

                                                                                  If you’ve been allotted shares, here’s what to keep in mind ahead of the listing on Monday, January 20, 2025:

                                                                                  1. Monitor Market Trends: Observe pre-listing trends to gauge potential price movements.
                                                                                  2. Set Realistic Expectations: While the GMP indicates a premium, market dynamics can fluctuate.
                                                                                  3. Track Listing Details: Shares will be listed on BSE and NSE simultaneously.

                                                                                  Conclusion

                                                                                  The Laxmi Dental IPO’s massive oversubscription reflects robust investor confidence in the company’s growth prospects and market position. With allotment and listing dates fast approaching, all eyes are on how the shares will perform in the public market. Stay informed and check your allotment status to be prepared for the next steps.

                                                                                  Related Posts

                                                                                  Return on Capital Employed (ROCE) is a crucial financial metric that helps investors evaluate a company’s profitability and capital efficiency. But what exactly does it mean, and why is it essential for investors and businesses? 

                                                                                  Let’s explore ROCE, how it’s calculated, and why it plays a pivotal role in the stock market.

                                                                                  Understanding What is ROCE

                                                                                  ROCE shows how efficiently a company uses its capital to generate profits. A key performance ratio helps investors see how well a business turns its resources into earnings. Stock market investors value ROCE because it highlights a company’s profitability compared to its total capital investment.

                                                                                  When considering ROCE in stock market, it’s vital to understand that higher ROCE values typically indicate better financial health and operational efficiency. For companies operating in capital-intensive industries, such as manufacturing or infrastructure, ROCE becomes an important financial ratio to gauge their potential returns.

                                                                                  Formula for ROCE

                                                                                  The formula for calculating ROCE is straightforward:

                                                                                  ROCE = EBIT (Earnings Before Interest and Taxes) / Capital Employed

                                                                                  Here:

                                                                                  • EBIT: Represents a company’s operating profit.
                                                                                  • Capital Employed: The total capital invested in the business is the sum of equity and debt minus current liabilities.

                                                                                  For example, if a company has an EBIT of ₹100 crore and a capital employed of ₹500 crore, its ROCE would be:

                                                                                  ROCE = 100 / 500 = 20%

                                                                                  The company generates a 20% return on every rupee invested in its business.

                                                                                  Let’s understand ROCE calculations using another example.

                                                                                  Suppose Company A Ltd. has an EBIT of Rs 400 Crore in a financial year. On the other hand, Company B Ltd. has an EBIT of Rs 350 Crore in the same financial year.

                                                                                  Company A Ltd. might initially appear as a better investment due to its higher EBIT. However, it’s crucial to consider the capital employed to generate these earnings.

                                                                                  Company A Ltd.Company B Ltd.
                                                                                  Capital EmployedRs 1200 CroreCapital Employed  Rs 900 Crore
                                                                                  EBITRs 400 CroreEBITRs 350 Crore
                                                                                  ROCE 400 Crore / 1200 Crore = 0.3333 or 33.33%ROCE350 Crore / 900 Crore = 0.3889 or 38.89%
                                                                                  This calculation reveals that Company B Ltd., despite having a lower EBIT, demonstrates a higher ROCE. This indicates that it is more efficient in using its capital to generate profits.

                                                                                  Key Takeaway:

                                                                                  ROCE provides a more accurate measure of profitability by considering the capital invested. Simply comparing EBIT figures can be misleading, as it doesn’t account for the capital employed to generate those earnings.

                                                                                  Why is ROCE Important?

                                                                                  Investors and analysts value ROCE for several reasons:

                                                                                  • Measuring Profitability

                                                                                  ROCE answers, “How effectively is a company using its capital to generate profits?” Unlike other ratios, such as the PE ratio or PB ratio, ROCE considers both equity and debt, making it a more holistic measure of profitability.

                                                                                  • Comparison Across Industries

                                                                                  Understanding what is ROCE becomes even more significant when comparing companies within the same industry. A higher ROCE suggests that the company manages its resources better than its peers.

                                                                                  • Indicator of Long-Term Performance

                                                                                  For businesses that require significant investment in assets, such as power plants or factories, ROCE offers insights into their ability to sustain long-term profitability.

                                                                                  ROCE vs. Other Important Financial Ratios

                                                                                  While ROCE is a valuable metric, it’s essential to use it alongside other ratios for a comprehensive analysis. Let’s compare ROCE with some other important financial ratios:

                                                                                  PE (Price-to-Earnings) Ratio

                                                                                  The PE Ratio focuses on the company’s market valuation relative to its earnings. While the PE ratio helps understand how the market values a company, it doesn’t provide insights into operational efficiency as ROCE does.

                                                                                  PB (Price-to-Book) Ratio

                                                                                  The PB Ratio compares a company’s market value to its book value. While the PB ratio helps evaluate whether a stock is undervalued or overvalued, ROCE dives deeper into how well the company utilizes its capital to generate returns.

                                                                                  ROCE vs ROE

                                                                                  Return on Equity (ROE) focuses on how effectively a company utilizes the capital shareholders invest to generate profits. It measures the net income earned by a company relative to its shareholder equity.

                                                                                  In contrast, Return on Capital Employed (ROCE) takes a broader perspective. It considers all sources of capital used to finance the business, including equity and debt. It measures a company’s profitability relative to the total capital employed.

                                                                                  How ROCE Impacts the Stock Market

                                                                                  When analyzing what is ROCE in stock market, it’s important to understand how this metric influences investment decisions. Companies with high ROCE are often seen as more attractive to investors because they indicate efficient use of capital and strong operational performance.

                                                                                  1. Stock Selection

                                                                                  Investors often include ROCE in their checklist of important financial ratios to identify companies with sustainable profitability. A consistent ROCE over time is a sign of a well-managed business.

                                                                                  2. Growth Potential

                                                                                  High ROCE suggests that a company can reinvest its profits effectively to generate further growth, which is a critical factor for long-term stock market success.

                                                                                  3. Valuation Metrics

                                                                                  ROCE complements other valuation metrics like the PE ratio and PB ratio. For instance, a company with a low PE ratio but a high ROCE might indicate undervaluation, making it an attractive investment opportunity.

                                                                                  Factors Influencing ROCE

                                                                                  Several factors can impact a company’s ROCE, including:

                                                                                  • Industry Dynamics

                                                                                  Capital-intensive industries have lower ROCE than asset-light businesses like IT or services. Understanding what is ROCE requires taking industry benchmarks into account.

                                                                                  • Debt Levels

                                                                                  Higher debt levels increase capital employed, potentially lowering ROCE. Companies that rely heavily on debt might show lower efficiency in utilizing their capital.

                                                                                  • Operational Efficiency

                                                                                  Efficient cost management and higher profit margins contribute positively to ROCE. Companies with streamlined operations generally exhibit better ROCE.

                                                                                  ROCE: Advantages and Limitations

                                                                                  Advantages of ROCE:

                                                                                  1. Holistic Measure: ROCE considers equity and debt, making it a comprehensive metric for assessing a company’s ability to generate returns from its total capital employed. This balanced approach provides investors with a clearer picture of the overall efficiency of capital utilization.
                                                                                  2. Long-Term Indicator: Unlike short-term metrics, ROCE evaluates operational efficiency over a more extended period, revealing the sustained profitability of a company. It helps investors understand how effectively a company utilizes its resources for consistent returns.
                                                                                  3. Comparability: ROCE enables easy comparison of companies within the same industry. By standardizing the measurement of capital efficiency, it allows investors to identify which firms are outperforming their peers in utilizing capital to generate profits.

                                                                                  Limitations of ROCE:

                                                                                  1. Ignores Cash Reserves: ROCE does not account for idle cash or unused reserves, which can distort a company’s actual performance. High cash holdings, while a sign of liquidity, might reduce the metric’s reliability in reflecting actual operational efficiency.
                                                                                  2. Non-Applicability to Certain Sectors: ROCE may not be suitable for startups or industries with volatile earnings, such as tech or biotech. These businesses often reinvest heavily in growth rather than generating immediate returns, making ROCE less reflective of their potential.

                                                                                  How to Use ROCE Effectively

                                                                                  • Combine with Stock Market Advisory

                                                                                  Consulting a stock market advisory can help you interpret ROCE alongside other important financial ratios, such as the PE and PB ratios, to make informed decisions.

                                                                                  • Compare Over Time

                                                                                  Analyze a company’s ROCE trends over multiple years to assess consistency and growth.

                                                                                  • Industry Benchmarking

                                                                                  Compare ROCE with industry peers to understand relative performance.

                                                                                  Final Thoughts on What is ROCE

                                                                                  By now, you should have a clear understanding of what is ROCE and its significance in evaluating a company’s financial health. This metric is not just another number; it’s a window into how efficiently a business utilizes its resources to generate profits. Whether you’re an investor analyzing stocks or a business owner looking to improve performance, ROCE is a tool you can’t ignore.

                                                                                  By combining ROCE with other metrics like the PB ratio and PE ratio and consulting reliable stock market advisory services, you can build a robust framework for making sound financial decisions. 

                                                                                  FAQs on ROCE

                                                                                  1. What is ROCE?

                                                                                    ROCE (Return on Capital Employed) measures a company’s profitability relative to the capital invested. It shows how efficiently a company uses its money to generate profits.

                                                                                  2. How is ROCE calculated?

                                                                                    ROCE is calculated by dividing Earnings Before Interest and Tax (EBIT) by the total capital employed. Capital employed is the sum of a company’s equity and debt.

                                                                                  3. What does a high ROCE indicate?

                                                                                    A high ROCE suggests a company is generating strong profits with efficient use of its capital. It indicates strong financial performance and investment potential.

                                                                                  4. What does a low ROCE indicate?

                                                                                    A low ROCE may signal inefficient capital allocation, excessive debt, or weak profitability. It could indicate potential financial distress or poor investment opportunities.

                                                                                  5. How do investors use ROCE?

                                                                                    Investors use ROCE to compare the profitability of different companies within the same industry. It helps them identify companies with strong financial performance and assess investment risks.

                                                                                  The Indian stock markets have recently experienced a significant shake-up, with the Nifty 50 index sinking to its lowest level in seven months and small-cap stocks taking a heavy hit. What are the key reasons behind this sharp downturn? And how have global and domestic factors combined to put immense pressure on broader markets? Let’s look into the details to understand the triggers behind this market turbulence.

                                                                                  Market Overview

                                                                                  On January 13, 2025, the Indian stock markets witnessed a sharp decline. The BSE Sensex dropped by 1,049 points, closing at 76,347.26, while the NSE Nifty 50 fell by 346 points, ending at 23,085.95. Both indices reached their lowest levels in seven months. The Nifty Smallcap 100 index tumbled 4%, settling at 16,912.90, marking its lowest level since mid-June. Mid- and small-cap indices have suffered disproportionately, with the Nifty Smallcap 100 plunging 10% over the past four sessions. From its December 2024 all-time high, the Smallcap 100 index has lost 15% in just 22 trading sessions.

                                                                                  image 4
                                                                                  Source: NSE

                                                                                  Key Factors Behind the Decline

                                                                                  1. Global Economic Indicators

                                                                                  Global factors triggered the selloff, primarily stronger-than-expected US jobs data released last Friday. This dashed hopes of early rate cuts by the Federal Reserve, causing US bond yields and the dollar index to soar. As a result, emerging markets like India came under pressure. Adding to these woes, crude oil prices surged to 15-week highs due to fresh US sanctions on Russian oil, further fueling inflationary concerns.

                                                                                  2. Foreign Portfolio Investor (FPI) Outflows

                                                                                  Foreign investors have been net sellers in Indian equities, intensifying the negative sentiment. On January 13 alone, FPIs net sold Rs 4,900 crore, adding to the Rs 20,000 crore outflows in January 2025. Such sustained selling has placed significant downward pressure on the markets. Source: Mint

                                                                                  3. Depreciation of the Indian Rupee

                                                                                  The Indian rupee weakened to a record low of Rs 86.59 against the US dollar. A weaker currency often increases import costs and inflationary pressures, impacting corporate profitability and investor confidence. Meanwhile, India’s 10-year bond yield rose by 7 basis points to 6.85%, signaling increased borrowing costs.

                                                                                  image 5
                                                                                  Source: NSE

                                                                                  4. Concerns Over Corporate Earnings

                                                                                  Recent quarterly updates from companies like Dabur India and Hero MotoCorp have been less than encouraging, raising fears of earnings moderation. Market participants are cautious about sectors with stretched valuations, amplifying the selloff in small—and mid-cap stocks.

                                                                                  5. Sectoral Weakness

                                                                                  The sell-off has been broad-based, but certain sectors have faced more significant challenges. Realty, metals, consumer durables, and media stocks were hit the hardest. However, some resilience was observed in IT, FMCG, and select pharma stocks, which managed to hold up relatively well despite the broader market turmoil.

                                                                                  6. Anticipation of the Union Budget

                                                                                  The upcoming Union Budget 2025-26 has introduced uncertainty as investors await clarity on policy changes that could impact various sectors and economic growth. This has contributed to a risk-averse sentiment in the markets.

                                                                                  Broader Market Stress

                                                                                  Mid- and small-cap indices have borne the brunt of the downturn. The Nifty Smallcap 100 index has declined by approximately 11.4% from its January high of 19,080 and is down 15% from its all-time high reached in December 2024. Analysts say this extreme pessimism reflects broader market concerns around stretched valuations and weak earnings expectations.
                                                                                  Source: Mint

                                                                                  image 6
                                                                                  Source: NSE

                                                                                  Sectoral Performance

                                                                                  The market downturn has impacted sectors differently, revealing both vulnerabilities and areas of resilience:

                                                                                  • Information Technology (IT): The IT sector demonstrated relative stability, with a decline of only 1.4%. This resilience is attributed to strong demand for digital transformation services and steady global IT spending despite broader economic concerns.
                                                                                  • Pharma and FMCG: Select stocks in the pharmaceutical and FMCG sectors performed well due to their defensive nature. Due to their stable demand, these sectors often attract investor interest during periods of market uncertainty.
                                                                                  • Realty: Realty stocks were among the worst-hit, reflecting concerns about rising interest rates and weakening demand. Developers face challenges from higher borrowing costs and inflationary pressures, which have affected buyer sentiment.
                                                                                  • Metals: The metals sector faced a significant correction, driven by fears of slowing global demand and price volatility in key commodities.
                                                                                  • Consumer Durables: High inflation and weakening consumer sentiment have weighed heavily on this sector, reducing investor confidence.
                                                                                  • Media: Media stocks also faced significant pressure, with advertising revenues under strain due to broader economic concerns. Source: Money Control

                                                                                  Investor Sentiment

                                                                                  The convergence of domestic and global factors has heightened volatility and led to a risk-averse stance among investors. The anticipation of the Union Budget and global uncertainties has resulted in cautious trading, with many reducing exposure to equities, particularly in the small-cap segment.

                                                                                  Conclusion

                                                                                  The recent plunge in the Nifty to seven-month lows and significant declines in small-cap stocks stems from global and domestic factors. Key triggers include robust US economic data, foreign investor outflows, rupee depreciation, and concerns over corporate earnings. The surge in crude oil prices and anticipation of the Union Budget have added to the market’s challenges. As markets navigate these headwinds, all eyes remain on upcoming economic developments and policy announcements to guide the way forward.

                                                                                  Introduction:

                                                                                  A company’s financial performance shows how well it uses its assets, earns money, and runs its business. Simply put, it reveals how healthy and financially stable it is. But how do we analyze that? Some important financial ratios and metrics help assess if a business meets industry standards or falls short in profiting. One metric stock market advisory company and investors often rely on is the ROE. What is it, and why is it essential when analyzing companies? Let’s find out.

                                                                                  What Is The Concept Of ROE?

                                                                                  ROE is a primary part of the answer to the question, “What is fundamental analysis?” The return on equity (ROE) ratio measures how well a company generates profits from its shareholders’ investments. Simply, it shows how much profit is earned for every rupee of equity. For instance, an ROE of 1 means that every rupee of equity generates 1 rupee of net income. This is a crucial metric for potential investors, highlighting how efficiently a company uses its money to earn profits.

                                                                                  ROE also reflects how effectively the management utilizes equity financing to run operations and grow the business. Unlike other return-on-investment ratios, ROE focuses on profitability from the investor’s perspective. It calculates the earnings generated based on the shareholders’ investment, not the company’s investment in assets or other areas.

                                                                                  Investors prefer a higher ROE as it shows the company is making the most of its funds. However, ROE should be evaluated within the same industry since industries have varying investment requirements and income levels. Comparing ROE across different industries may thus lead to inaccurate insights.

                                                                                  How Is ROE Different From ROCE and ROA?

                                                                                  Though all three are profitability ratios, the three differ in the following manner-

                                                                                  AspectROA (Return on Assets)ROE (Return on Equity)ROCE (Return on Capital Employed)
                                                                                  FocusProfitability from total assetsProfitability from shareholders’ equityProfitability from combined capital (debt + equity)
                                                                                  FormulaNet Income / Average Total AssetsNet Income / Average Shareholders’ EquityEBIT / (Total Assets – Current Liabilities)
                                                                                  IndicatesHow effectively do assets generate earningsHow well shareholder investments generate profitsHow efficiently capital is used to generate operating profits
                                                                                  Preferred-ValueHigher indicates better asset utilizationHigher indicates greater equity financing efficiencyHigher indicates optimal use of both debt and equity
                                                                                  UsageEvaluates management’s ability to convert assets into profitEvaluates profitability from shareholder investmentsEvaluates operational efficiency with available capital
                                                                                  ConsiderationsIndependent of capital structure; useful for asset-heavy industriesImpacted by financial leverage, higher equity lowers ROEReflects holistic profitability, blending debt and equity
                                                                                  Ideal ApplicationComparing asset-heavy companies or assessing operational efficiencyAssessing return for equity investorsEvaluating businesses with significant debt and equity mix

                                                                                  How To Calculate ROE?

                                                                                  The ROE formula used to calculate the return on equity is

                                                                                  ROE = (Net Income / Shareholders’ Equity) x 100

                                                                                  Here, 

                                                                                  • Net income is a company’s profit after subtracting all expenses, taxes, and interest. It shows the company’s overall financial performance.
                                                                                  • Shareholders’ equity is the company’s net worth, the difference between total assets and total liabilities. It represents what shareholders own in the company after debts are paid.

                                                                                  For instance, assume that company A has a net income of Rs.50,00,000 and the shareholder’s equity comes to Rs.2,00,00,000. In that case, the ROE would be

                                                                                  ROE = (5000000/20000000) x 100 = 25%

                                                                                  25% ROE means the company generated Rs.0.25 or 25 paise profit against every Re.1 of the shareholder’s equity.

                                                                                  The ROE can also be calculated using these three different variations of the basic formula-

                                                                                  • To find the return on common equity (ROCE), subtract preferred dividends from net income and divide by common equity. The formula is:

                                                                                  ROCE = (Net Income – Preferred Dividends) / Common Equity

                                                                                  For instance, say a company has a net income of Rs.10 lakh, preferred dividends of Rs.2 lakh, and common equity of Rs.50 lakh. The ROCE for this variation will be 

                                                                                  ROCE = (1000000 – 200000) / 5000000 = 0.16 or 16%

                                                                                  • Another way is to divide net income by the average shareholder equity. To calculate average shareholder equity, add the equity at the start of a period to the equity at the end and divide by two.

                                                                                  So, if a company has a net income of Rs.8 lakh, and the shareholder equity at the start of the year is Rs.40 lakh, and at the end of the year is Rs.60 lakh, the ROCE will be

                                                                                  ROCE = Net Income / Average Shareholders’ Equity = 800000/5000000 = 0.16 or 16%.

                                                                                  • You can also track changes in ROE over a specific period. Start by using the shareholders’ equity at the beginning of the period as the denominator to calculate the starting ROE. Then, use the shareholders’ equity at the end of the period to find the ending ROE. For instance, A company starts the year with equity of Rs.30 lakh and ends the year with Rs.40 lakh.

                                                                                  Net income for the first half is Rs.6 lakh. So, starting ROE = 6,00,000 / 30,00,000 = 0.20 or 20%.

                                                                                    Net income for the second half is Rs.4 lakh. Then the ending ROE = 4,00,000 / 40,00,000 = 0.10 or 10%.

                                                                                      The drop in ROE from 20% to 10% shows declining profitability over the year. Comparing these figures shows how profitability has changed during the period.

                                                                                      ALSO READ:

                                                                                      Further Breaking Down The ROE With DuPont Formula:

                                                                                      In addition, you can use the DuPont formula to break down the ROE components further and analyze them in detail. ROE shows how efficiently a company uses shareholders’ capital, calculated by dividing net income by shareholders’ equity. 

                                                                                      The DuPont analysis takes this a notch higher, highlighting which financial activities most impact ROE. This information helps compare the efficiency of similar companies and helps managers spot strengths or areas for improvement.

                                                                                      The DuPont formula is-

                                                                                      ROE = (net income / sales) x (sales / total assets) x (total assets / shareholder’s equity)

                                                                                      In this, the ROE is divided into three ratios that denote the different aspects of ROE-

                                                                                      • Net Profit Margin (net income/sales): Measures operational efficiency as net income generated per rupee of sales.
                                                                                      • Total Asset Turnover (sales/total assets): This shows how well assets are used to generate sales.
                                                                                      • Equity Multiplier (total assets/shareholder’s equity): Evaluate the financial leverage used by the company.

                                                                                      How To Interpret ROE?

                                                                                        Compare ROE with Industry Averages

                                                                                        Look at a company’s ROE compared to its industry average. A higher ROE suggests that the company efficiently uses shareholders’ equity to generate profits. Take TCS’s ROE, for instance. The company reported an impressive ROE of 51.04% in FY2024, far exceeding the IT industry’s average of 18%. This highlights TCS’s strong profitability and efficient capital use compared to its peers. On the other hand, a lower ROE could mean the company struggles to stay competitive.

                                                                                          Analyze ROE Trends Over Time

                                                                                          Check how a company’s ROE has changed over the years. A steady rise in ROE is usually a positive sign, showing consistent profit growth for shareholders. But, if ROE fluctuates or declines, it might signal issues that need deeper investigation.

                                                                                            The Ideal ROE

                                                                                            There is no one-size-fits-all number. The ideal ROE depends on the industry and the company’s specific situation. An ROE of 15% or higher is often considered healthy. Comparing it with peers clarifies the assessment.

                                                                                            ROE offers a reliable snapshot of a company’s financial performance, but context matters. A stable ROE suggests that the company effectively uses equity to generate profits. Still, external factors like market dynamics and economic conditions can impact ROE. So, always evaluate ROE alongside other financial ratios and indicators for a clearer picture.

                                                                                            Bottomline:

                                                                                            Think of ROE as a tool to spot industry leaders. A high ROE often indicates strong profit potential. But don’t rely on it alone—constantly evaluate all aspects of a company before investing. ROE, which can be easily calculated using a financial calculator, is one of many metrics used to assess a company’s performance, growth potential, and financial stability. Growth prospects are crucial in judging profitability, so it is important to scrutinize them. The return on equity ratio and other financial ratios can help gauge a company’s potential. Make sure to use them wisely when making investment

                                                                                            Related Posts


                                                                                            FAQ

                                                                                            1. What does a negative ROE indicate?

                                                                                              A negative ROE signals problems with debt, asset retention, or both within the organization.

                                                                                            2. What does a company with a high ROE signify?

                                                                                              Companies with high ROE generate significant profit relative to shareholders’ equity, efficiently using investors’ money. They excel in retaining earnings, reinvesting them as working capital, and reducing reliance on debt. High-ROE companies often outperform competitors due to advanced technology, efficient operations, or strong branding, helping them generate more earnings than peers.

                                                                                            3. How is ROI different from ROE?

                                                                                              ROI measures the overall return on your investment, giving a broader financial perspective. ROE, however, zooms in on the returns shareholders earn based on their equity in a company.

                                                                                            No more posts to show

                                                                                            Frequently asked questions

                                                                                            Get answers to the most pertinent questions on your mind now.

                                                                                            No FAQs found in this category.

                                                                                            What is an Investment Advisory Firm?

                                                                                            An investment advisory firm is a company that helps investors make decisions about buying and selling securities (like stocks) in exchange for a fee. They can advise clients directly or provide advisory reports and other publications about specific securities, such as high growth stock recommendations. Some firms use both methods, like Research & Ranking, India’s leading stock advisory company, specializing in smart investments and long-term stocks since 2015.

                                                                                            An investment advisory firm is a company that helps investors make decisions about buying and selling securities (like stocks) in exchange for a fee. They can advise clients directly or provide advisory reports and other publications about specific securities, such as high growth stock recommendations. Some firms use both methods, like Research & Ranking, India’s leading stock advisory company, specializing in smart investments and long-term stocks since 2015.

                                                                                            An investment advisory firm is a company that helps investors make decisions about buying and selling securities (like stocks) in exchange for a fee. They can advise clients directly or provide advisory reports and other publications about specific securities, such as high growth stock recommendations. Some firms use both methods, like Research & Ranking, India’s leading stock advisory company, specializing in smart investments and long-term stocks since 2015.

                                                                                            An investment advisory firm is a company that helps investors make decisions about buying and selling securities (like stocks) in exchange for a fee. They can advise clients directly or provide advisory reports and other publications about specific securities, such as high growth stock recommendations. Some firms use both methods, like Research & Ranking, India’s leading stock advisory company, specializing in smart investments and long-term stocks since 2015.

                                                                                            Who we are

                                                                                            SEBI registered investment advisory services

                                                                                            Media, Award & Accolades

                                                                                            Stay updated with our winning journey

                                                                                            Video Gallery

                                                                                            Watch our exclusively curated financial videos

                                                                                            Performance

                                                                                            Know the journey of stocks

                                                                                            Newsletters

                                                                                            Stay on top of the stock market

                                                                                            Contact us

                                                                                            Stay in touch

                                                                                            5 in 5 Strategy

                                                                                            A portfolio of 20-25 potential high-return stocks

                                                                                            MPO

                                                                                            1 high-growth stock recommendation/ month, that is trading below its intrinsic value

                                                                                            Combo

                                                                                            A combined solution of 5-in-5 wealth creation strategy & mispriced opportunities

                                                                                            Dhanwaan

                                                                                            Manage your portfolio with dhanwaan

                                                                                            Informed InvestoRR

                                                                                            A step by step guide to sharpen your investing skills

                                                                                            EPW Coming soon

                                                                                            A concentrated portfolio of 12-18 high-growth & emerging theme stocks

                                                                                            Pricing

                                                                                            Choose from our range of pricing packages