1. Home
  2. Blog
  3. Fundamental Analysis of Stocks
  4. Page 4

Fundamental Analysis of Stocks

Know company background, financials, & more

Introduction The Indian Pharmaceutical Industry is one of the world’s largest in terms of production by volume and value. It […]

Introduction

The Indian Pharmaceutical Industry is one of the world’s largest in terms of production by volume and value. It produces over 60,000 generic drugs in 60 different therapeutic categories. It meets 60% of the global vaccine demand, 40% of generic medicine demand in the US, 25% of all medicines in the UK, and exports drugs valued at over $24 billion globally.

This article will analyze India’s leading and most valuable pharmaceutical company Sun Pharma. The company had a humble beginning in 1983 and is now a world leader in generic and specialty medicines, with global sales of over $5 billion.

Let’s dig deeper into the company and see the Sun Pharma share price growth potential.

Sun Pharma Company Journey

Sun Pharma was established by Dilip Shanghvi in 1983 in Vapi, Gujarat, and initially focused on five products catering to psychiatric ailments. Before venturing into entrepreneurship, Dilip Shanghvi had gained experience as a helper in his father’s wholesale drug business based in Kolkata.

After completing his bachelor’s degree in commerce from the University of Calcutta in 1982, Shanghvi started his own company. With a small loan from his father, he aimed to produce high-quality medicines at affordable prices.

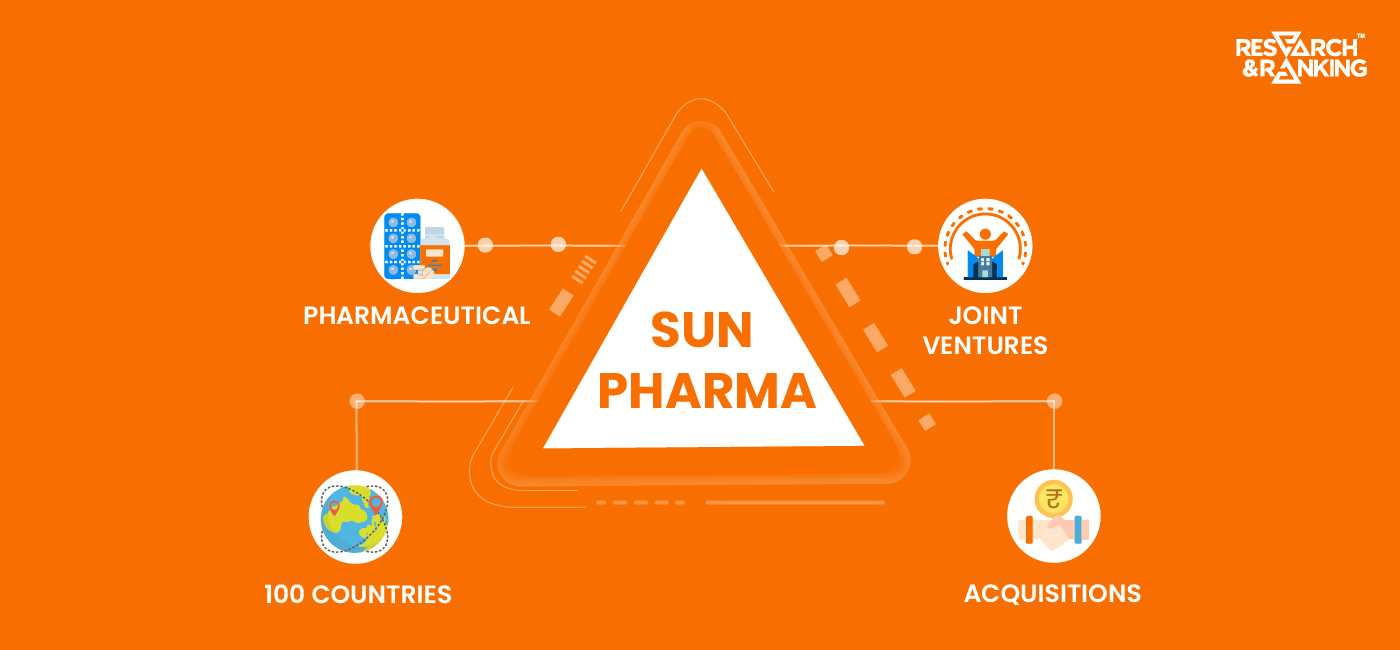
In 1988 Sun Pharma introduced its first cardiology products and expanded its offerings to include API manufacturing by 1995. Today, it stands as the fourth-largest specialty generic pharmaceutical company globally, with over $5.1 billion in revenue and over 40 state-of-the-art manufacturing facilities. Its reach extends to over 100 countries worldwide, providing essential medicines to a diverse population across the globe.

In the last 40 years, the company has acquired numerous companies worldwide, including Taro Pharma, URL Pharma, Pola Pharma in Japan, Biosintez in Russia, and Ranbaxy.

Sun Pharma Company Analysis

Sun Pharma’s marketed portfolio comprises innovative specialty medicines, branded generics, pure generics, and APIs. The company’s business is divided into seven different clusters:

  • US Business
  • India Business
  • Emerging Market Business
  • Global Specialty Business
  • Rest of the World Business
  • Global Consumer Healthcare Business
  • API Business

Sun Pharma’s US Business comprises sales of specialty and generic medicines. It is the 10th largest generics pharmaceutical company in the US and ranked 2nd by prescriptions in the US dermatology market. In FY23, the US business contributed 31% to the company’s consolidated revenues.

The company’s India Business contributes 32% to the consolidated revenue with an 8.3% market share. It offers a comprehensive product portfolio across various therapeutic and other segments.

Sun Pharma is one of the leading pharmaceutical companies in the Emerging Markets Business, with a presence in 80 countries. It accounted for 18% of the consolidated revenue for FY23.

The Rest of the World Business includes Western Europe, Canada, Israel, Japan, Australia, New Zealand, and other markets. It contributed 14% to the consolidated revenue in FY23.

Sun Pharma’s Global Consumer Healthcare Business is among India’s top five consumer healthcare companies, with a science-based portfolio and footprints in 25 emerging countries. Some iconic brands in the portfolio include Revital, Volini, and Abzorb.

Sun Pharma’s next emerging business is API Business, which caters to captive needs while supplying large generics manufacturers and innovator companies. It accounted for 5% of the consolidated revenue for FY23.

Operating Segments

Sun Pharma derives all its revenue from the sale of pharmaceutical products. Hence no different business segments are reported. Therefore, the group reportable segments are geography.

  • India
  • United States of America
  • Emerging Markets
  • Rest of the World

Key Management Personnel

  • Dilip Shangvi is the Managing Director and leads the company’s operations.
  • Abhay Gandhi is the CEO of North America and looks after the business operations in US and Canada. He joined Sun Pharma in 1995 as DGM- Marketing.
  • Kirti Ganorkar is the CEO of India Business and joined the company in 1996.
  • S. Damodharan is the CEO of API Business.
  • Dr. Sapna Purohit is Senior Vice-President and Head of Human Resources and joined Sun Pharma in May 2018.
  • And C.S. Muralidharan is the group’s chief financial officer and has been associated with the company since June 2017.

Sun Pharma Shareholding Pattern

image 37
* As of 30th June 2023

Sun Pharma Financials

Revenue

In FY23, Sun Pharma reported an 11.98% rise in total income to ₹44,520 crores, up from ₹39,756 crores in FY22. And, in Q1FY24, the total income was ₹12,145 crores, up by 12.8% compared to 10,763.9 crores in Q1FY23.

image 38

Segment-wise Revenue

 FY21 (in ₹ cr.)FY22 (in ₹ cr.)FY23 (in ₹ cr.)
India10,958.313,443.814,162.4
United States of America10,364.711,734.3  13,970.4
Emerging Markets6,405.87,275.68,563.3
Rest of the World5,504.15,972.56,582.7

EBITDA

In FY23, the company’s EBITDA increased by 12% to ₹11,646 crores, from ₹10,169 crores in FY22. And, in Q1FY24, EBITDA was reported at ₹3,313.8 crores, up by 15.5% compared to Q1FY23.

image 39

Net Profit

In FY23, Sun Pharma reported 159% year-on-year growth in net profit to ₹8,473.6 crores, from ₹3,272 crores in FY22. And, in Q1FY24, the company reported a 13.8% increase in net profit of ₹2,025 crores, over Q1 last year.

image 40
image 41

Financial Ratios

  • Current Ratio: At the end of FY23, the company’s current ratio was stable at 2x.
  • Debt-to-equity Ratio: Due to an increase in borrowing during FY23, the company’s debt-to-equity ratio increased by 300% to 0.12 times from 0.03 times in FY22.
  • Interest Coverage Ratio: At the end of FY23, the interest coverage ratio deteriorated by 21.3% to 56.7 times from 72 in FY22.
  • Return on Equity (ROE): The ROE for FY23 increased to 15.9% from 15% in FY22.
  • Return on Capital Employed (ROCE): In FY23, the ROCE of the company increased marginally to 16.5% from 16.4% in FY22. In FY20, the ROCE was 11%.
  • Reserves & Surplus: The company has a huge war chest of ₹55,755 crores at the end of FY23.

Sun Pharma Share Price Analysis

Sun Pharma’s initial public offering (IPO) took place in December 1994 and was a massive success in the market. The issue price was ₹150 per share, and it was 55 times oversubscribed. It went public at around ₹220 per share.

As on 7th August 2023, Sun Pharma share price has given a CAGR return of 30% and 15% over the last 3 and 5 years, respectively.

sun pharma
Source: TradingView

Sun Pharma share price has increased dramatically over the last five years, rising from ₹312 on March 30th, 2020, to ₹1166 on August 7th, 2023. It is trading near its all-time high level of ₹1200.80.

The company has a track record of consistently paying dividends to its shareholders. In the last three years, it has paid ₹7.5 in 2021, ₹10 in 2022, and ₹11.50 in 2023. Since it went public, the company had three bonus issues and split its shares twice. 100 shares held at IPO have turned 12,000 shares.

 Face ValueRatioNumber of Shares
Pre-bonus and split share₹10100
Bonus Issue- 9th Feb 2000₹102:1300
Stock Split- 13th January 2003₹510:5600
Bonus Issue- 21st April 2004₹51:11200
Stock Split- 24 January 2000₹15:16000
Bonus Issue- 28th May 2013₹11:112000

As of 7th August 2023, the market capitalization of Sun Pharma is ₹2.78 lakh crores.

Sun Pharma Fundamental Analysis

Sun Pharma is a leading global specialty generic drug maker with a market share of 8.3% in India and a well-diversified product portfolio of both Indian-branded and US formulations.

The company’s strategy is to produce therapy drugs, used to treat and prevent diseases. This strategy has paid off handsomely. For the global market, it focuses on three areas of therapy: Dermatology, Ophthalmology, and Onco Dermatology. Over the last five years, the international specialty business has been one of the key growth drivers.

US Formulations

US formulation refers to pharmaceutical products developed, manufactured, and approved for sale in the United States. These formulations are specifically tailored to meet the regulatory requirements and standards set by the U.S. FDA.

In FY23, US Formulations accounted for 31% of the consolidated revenue and ranked 2nd by prescriptions in the US dermatology market. The company has a market presence in specialty, generics, and OTC segments with a comprehensive product portfolio. Over the last five years, US Formulations’s revenue has grown at a CAGR of 4.76%, from ₹10,700 crores in FY19 to ₹13,500 crores in FY23.

Indian Formulations

The company’s Indian Formulations business accounted for 32% of the consolidated revenue in FY23 and is ranked no.1 by prescriptions with 12 classes of prescribers. And is a market leader in the chronic segment.

sp 1
Source: Q1FY24 Investor Presentation

Over the last five years, the revenue from Indian Formulations is growing at a steady rate. It has grown at a CAGR of 13.25% during the period, from ₹7,300 crores in FY19 to ₹13,600 crores in FY23.

Emerging Markets and the Rest of the World

In the emerging markets category, the company has a presence in over 80 countries and offers a strong basket of branded generics. It contributed 18% to the consolidated revenues in FY23.

While the rest of the world contributed 14% to the consolidated revenue, where the company offered a wide range of specialty, hospital, and retail products.

API Business

The company’s API business contributed 5% to the consolidated revenue in FY23 and has a product portfolio of approximately 370 APIs. It provides strong backward integration, helping reduce its dependency on third-party suppliers and supplying large generic drug manufacturers.

Sun Pharma Share Price Growth Potential

The company continues to grow ,rapidly, aided by strong sales in the specialty segment and improved product mix. The US and Indian market accounts for more than 60% of revenue and is on the path to further improvement with new product launches and expansion to new geographies.

However, heightened regulatory scrutiny, NLEM (National List of Essential Medicines) related price reductions in India, pricing environment, supply chain issues, and competition are a constant drag for the company.

Indian Pharmaceutical Industry

According to government data, the market size of the Indian Pharmaceutical Industry is around $50 billion as of 2020-2021 and is expected to reach $130 billion by 2030. And the Indian generics market is one of the fastest-growing and most lucrative segments of the global pharmaceutical industry, driven by factors like cost competitiveness, high-quality standards, increasing demand, and favorable government policies.

It presents substantial growth opportunities for companies like Sun Pharma, which has a strong balance sheet and reserves on its book to help expand its business lines. And it is likely to have a positive impact on the price of Sun Pharma share price over the long term.

*Disclaimer Note: The securities quoted, if any, are for illustration only and are not recommendatory. This article is for education purposes only and shall not be considered as recommendation or investment advice by Research & Ranking. We will not be liable for any losses that may occur. Investment in securities market are subject to market risks. Read all the related documents carefully before investing. Registration granted by SEBI, membership of BASL, and certification from NISM in no way guarantee the performance of the intermediary or provide any assurance of returns to investors.

FAQs

Who founded Sun Pharma?

Sun Pharma was founded by Dilip Shangvi in 1983 in Vapi, Gujarat, and initially started with five products catering to psychiatric ailments. Before founding Sun Pharma, Dilip Shangvi was assisting his father in this wholesale drug business in Kolkata as a helper.

How has Sun Pharma share price performed in the last five years?

As of 7th August 2023, Sun Pharma share price has given a CAGR return of 30% in the last five years, rising from ₹312 on March 30th, 2020, to ₹1166 on August 7th, 2023.

How has Sun Pharma share price performed since its IPO?

Sun Pharmaceutical went public in 1994. Its IPO was priced at ₹150 per share and listed on the ₹220. The stock was split twice, and the company issued bonus shares three times. 100 shares purchased at the IPO has grown to 1200 shares.

Read more:  How Long-term investing helps create life-changing wealth – TOI.

Introduction Over the last decade, the share of credit disbursed to and by NBFCs in India has experienced significant growth, […]

Introduction

Over the last decade, the share of credit disbursed to and by NBFCs in India has experienced significant growth, rising from approximately 10% in 2013 to slightly over 35% in the first half of 2023. This expansion highlights their continuous efforts to strengthen their presence in the credit market, posing formidable competition to traditional banks. As of September 2022, NBFCs collectively held an impressive outstanding amount of ₹31.5 lakh crores.

Several factors have contributed to the solidification of NBFCs’ position in India. These include enhanced financial inclusion, the emergence of fintech solutions, advancements in technology and digitalization, the growing popularity of financial products, and increasing income levels across various household segments.

This blog will look at the fundamentals of Mahindra & Mahindra Financial Services, one of India’s most popular NBFCs in the automobile lending space, and assess its future growth potential.

Mahindra & Mahindra Financial Services Company Journey

Mahindra Finance began operations in the early 1990s when India was gradually liberalizing its economy. Initially known as Maxi Motors Financial Services Limited, the company was founded in 1991 and rebranded to Mahindra & Mahindra Financial Services the following year.

It began as a captive financier of Mahindra Utility Vehicles and later began financing the purchase of tractors with a particular focus on semi-urban and rural areas. In 2002, it started funding non-Mahindra vehicles.

Mahindra & Mahindra Financial Services is into Vehicle Financing, SME Financing, Consumer & Personal Loans, Rural Housing Finance, Insurance Broking, Asset Management & Mutual Fund Distribution. At the end of 31st March 2023, the company has an asset under management of close to ₹1 lakh crore.

Mahindra & Mahindra Financial Services Business Overview

Mahindra Finance is a pure brick-and-mortar NBFC with a presence in every state in India and footprints in 85% of its district, catering to the financing needs of people in semi-urban and rural India. The company has divided its business into six clusters:

  • Vehicle and Tractor Financing: It is the primary cluster of the company and contributes most to the revenue. The company is involved in diverse vehicle financing, including passenger, commercial, pre-owned tractors and construction equipment.
  • Consumer & Personal Loan: It offers an innovative and tailor-made product suite that meets customers’ requirements.
  • SME Financing: It offers project finance, equipment finance, working capital finance, and other specific SME financing. The group targets auto ancillary, engineering, and food/agri-processing industry sectors for SME financing.
  • Insurance Broking: Under this cluster, the company provides affordable life, health, and asset protection solutions to customers as per risk profile and requirements.
  • Housing Finance: Mahindra & Mahindra Financial Services, through its subsidiary Mahindra Rural Housing Finance Limited (MRHFL), offers various housing loans for purchase, construction, extension, and renovation. The company provides loans to individuals based in rural and semi-urban areas.
  • Asset Management & Mutual Fund Distribution: Simple saving instruments and mutual fund investment products are housed under this cluster. The Mahindra & Mahindra Financial Services offers mutual fund investments through its AMC- Mahindra Manulife Mutual Fund. As on 31st March 2023, the AMC’s asset under management stands at ₹9,503 crores and has 20 schemes across equity, debt, tax saving, and monthly income funds.

Despite having six different clusters, the company reports all its revenue under a single segment.

Mahindra & Mahindra Financial Services Management

Mr. Ramesh Iyer is the Vice-Chairman and Managing Director at Mahindra & Mahindra Financial Services and is currently leading the company’s operation. He is associated with the company since 1994 and has played an instrumental role in building the company and its diversification across multiple product verticals.

Mr. Raul Rebello is the Executive Direction and CEO-Designate. He will take over the position from April 29, 2024, and replace Mr. Ramesh Iyer, who is set to retire. Mr. Rebello joined Mahindra Finance on 1st September 2021 as Chief Operating Officer. Previously, he was with Axis Bank as Executive Vice President and the Head of Rural Lending and Financial Inclusion.

Mr. Vivek Karve is the company’s Chief Financial Officer and has rich experience of 25 years. He has strong experience in working across different sectors like Consumer Goods, IT Consulting, and Project Finance during his previous stints at P&G, Siemens Information Systems, and ICICI. Before joining Mahindra Finance, he was Marico Limited as Group CFO.

Mahindra Finance Shareholding Pattern

image 27
As on 30th June 2023

Mahindra & Mahindra Financial Services Financials

Revenue

In FY23, Mahindra Finance reported a 12.6% growth in total income at ₹12,832.4 crores, from ₹11,400.51 crores in FY22. And, in Q1FY24, the company reported a 25% growth in total income at ₹3,637 crores, from ₹2,914 crores in Q1FY23.

image 28

Net Interest Income (NII)

During FY23, Mahindra Finance’s NII was ₹7,605 crores, up 10.2% from ₹6900 crores. And, in Q1FY24, NII increased by 7% to ₹1,986 crores from ₹1,850 crores in Q1FY23.

image 29

Profit After Tax (PAT)

In FY23, Mahindra Finance reported an almost 80% increase in net profit to ₹2,071.2 crores from ₹1,150 crores in FY22. And, in Q1FY24, net profit increased by 51% year-on-year to ₹362 crores from ₹240 crores in Q1FY23.

image 30

Mahindra & Mahindra Financial Services Key Financial Ratios

  • Capital Adequacy Ratio (CAR): As of June 30th, 2023, the company’s CAR stood at 21.2% and is well above regulatory limits. A higher CAR indicates that the NBFC is better placed to absorb any shock of large loan defaults.
  • Provision Coverage Ratio (PCR): PCR is an important metric for any lending company. It represents how much percentage of bad assets a bank or financial institution can provide for from its own funds. Mahindra Finance has a PCR of 60.1% on Stage-3 in June 2023.
  • Stage-3 assets in NBFCs are loans overdue for more than 90 days.
  • Asset Quality: The company has reported sustained improvement in asset quality over the last year. Gross Stage-3 assets fell to 4.3% as of June 30th, 2023, from 8% in June 2022. Furthermore, gross Stage-2 assets fell to 6.4% from 11.7% in June 2022.
  • Credit Cost: Credit cost during Q1FY24 was 2.1%.
  • Net Interest Margin (NIM): At the end of FY23, NIM was 7.6%, which declined to 6.8% in Q1FY24.
  • Cost-to-Income Ratio: In FY23, the cost-to-income ratio increased to 42.1%, from 35.8% in FY22. And in Q1FY24, the ratio increased marginally to 40.3% from 39.6% in Q1FY23.

Mahindra & Mahindra Financial Services Share Price History

Mahindra Finance launched its IPO on 21st Feb 2021, raising ₹400 crores at a maximum per share price of ₹200. And the IPO was oversubscribed by 26 times.

As of 3rd August 2023, Mahindra & Mahindra Financial Services share price has given a CAGR return of 31% in the last three years. While over the five years period, it has underperformed the market and given a negative 2% CAGR return. It reached an all-time high level of ₹346.55 on 4th July 2023.

MM
Source: TradingView

Mahindra & Mahindra Financial Services has a consistent record of paying its shareholders dividends. It paid ₹0.80 in 2021, ₹3.60 in 2022, and ₹6 in 2023 as dividends. Its share was split once on 15th February 2013 at a 10:2 ratio, meaning each share with a face value of ₹10 was split into five and got a new face value of ₹2. As of 3rd August 2023, Mahindra & Mahindra Financial Services has a market capitalization of ₹35,325 crores.

Mahindra & Mahindra Financial Services Fundamental Analysis

  • Strong Growth in the Last Two Fiscals

Mahindra & Mahindra Financial Services is one of the leading NBFCs in semi-urban and rural India and has maintained a leadership position financing M&M Auto and Tractors.

Over the last few years, it has consistently increased its presence across India with a 1,386-branch network and is steadily growing its loan book.

image 31
image 32

In FY23, the company witnessed strong growth in the vehicle financing segment and expansion of the SME financing business resulting in the highest-ever annual disbursement of ₹49,541 crores. And Q1FY24, quarterly disbursements stood at ₹12,165 crores.

  • Consistent Improvement in Asset Quality

In the last five quarters, the company has showcased consistent improvement in gross and net stage-3 and stage-2 asset quality, aiding the growth of its profitability metrics.

Furthermore, FY23 collection efficiency was healthy at 96%, improving from 93% in FY22.

asset quality
Source: FY23 Annual Report
  • Mahindra Rural Housing Finance Limited (MHRFL)

In FY23, the company disbursed loans aggregating to ₹2,004 crores, as against ₹1,602 crores the previous year. And reported ₹21.7 crores in net profit, 54.5% lower compared to the previous year at ₹47.7 crores.

MHRFL primarily focuses on serving customers in rural India, and most loans disbursed were to customers with an average annual household income of less than ₹3 lahks.

Mahindra & Mahindra Financial Services Share Price Growth Potential

Let’s look at the company’s SWOT analysis to better understand Mahindra & Mahindra Financial Services share price growth potential.

Strengths

  • Strong patronage of its parent company- Mahindra & Mahindra Group
  • A strong player in automotive and tractor financing in rural and semi-urban towns
  • Vast distribution network, diversified product range, and robust collection system
  • Provides a comprehensive range of financial products essential throughout the various stages of a person’s life cycle, including loans, insurance, and investment offerings.
  • Long track record of operations, deep understanding of the automotive market, and  strong understanding of the customer needs

Weaknesses

  • Strong competition from banks and higher cost of funds
  • A limited understanding of product segments beyond automotive lending has hindered its growth and prevented the exploration of potential opportunities in other verticals
  • The company’s limited presence in urban and metro cities has caused it to miss out on a significant lending market opportunity
  • Lower household income in rural India has led to smaller-ticket-size loans being offered

Threats

  • Tightening regulatory norms for NBFC by RBI
  • Major impact on rural consumption pattern in case of elevated inflation levels and the slowdown in the economy
  • The company’s lack of diversification and high concentration of auto lending in its portfolio makes it susceptible to adverse effects from a slowdown in the automotive sector, which could impact it’s business and profitability.

Opportunities

  • Strong recovery in economic activity and increasing dispensable income in rural India, helping in the revival of rural consumption
  • Huge untapped potential in SME Financing and rural housing finance
  • Digitalization of processes is enabling data-driven decision making

Mahindra & Mahindra Financial Services Growth Outlook

Over the past few quarters, the company has displayed robust growth, effectively rebounding from the negative impact of the pandemic. With this positive momentum, it is confidently progressing towards achieving its guided vision by FY25.

Within the next two years, the company has set ambitious targets:

  • Doubling its assets under management.
  • Increasing the revenue contribution of new business initiatives from the current 6% to 15%.
  • Maintaining Net Interest Margins (NIMs) at 7.5%.
  • Reducing the cost-to-assets ratio from the current 3.2% to 2.5%.
  • Elevating the Return on Assets (ROA) from 2.3% to 2.5%.

Industry Outlook

Automobile and Vehicle Financing: In 2022 automobile sector contributed 7% to India’s GDP and 49% of its manufacturing GDP. It became the third-largest automobile market, surpassing Japan and Germany.

As per CRISIL’s analysis, the NBFC vehicle finance AUM is projected to experience a notable growth rate of 13-14% in FY2024, surpassing the estimated 12% growth observed in FY2023. This upswing is anticipated to be fueled by strong demand and the introduction of new cars and utility vehicles in the market.

NBFCs are expected to capitalize on their well-established last-mile connectivity and extensive presence in micro markets, channeling their efforts towards used-vehicle financing.

SME Financing: India’s MSME sector is the key driver of the credit offtake in the country. Several initiatives by the government and RBI, like the Digitized Loan Scheme Emergency Credit Line Guarantee Scheme (ECLGS), are helping in the revival of the MSME sector.

CRISIL predicts that the MSME sector will witness significant credit growth of 16-18% in the current fiscal year and FY25. This growth is expected to be driven by the government’s focus on self-sufficiency through the ‘Atmanirbhar Bharat’ initiative, along with the implementation of the Productivity Linked Incentive (PLI) scheme.

*Disclaimer Note: The securities quoted, if any, are for illustration only and are not recommendatory. This article is for education purposes only and shall not be considered as recommendation or investment advice by Research & Ranking. We will not be liable for any losses that may occur. Investment in securities market are subject to market risks. Read all the related documents carefully before investing. Registration granted by SEBI, membership of BASL, and certification from NISM in no way guarantee the performance of the intermediary or provide any assurance of returns to investors.

FAQs

When was Mahindra Financial Services established?

Mahindra & Mahindra Financial Services was incorporated 1991 as Maxi Motors Financial Services. It is primarily into automotive lending, focusing on rural and semi-urban towns.

How has Mahindra & Mahindra Financial Services share price performed?

As of 3rd August 2023, Mahindra & Mahindra Financial Services share price has given a CAGR return of 31% in the last three years and reached an all-time high level of ₹346.55.

When was Mahindra & Mahindra Financial Services shares listed on the stock exchange?

M&M Financial Services launched its IPO on 21st Feb 2021, raising ₹400 crores at a maximum per share price of ₹200. The IPO was oversubscribed by 26 times.

Read more:  How Long-term investing helps create life-changing wealth – TOI.

Introduction This Bank started as an NGO, became an NBFC, and finally became a universal bank. Driven by the philosophy […]

Introduction

This Bank started as an NGO, became an NBFC, and finally became a universal bank. Driven by the philosophy of ‘Aapka Bhala. Sabki Bhalai.’, (Your benefit. Everyone’s welfare.) Bandhan Bank’s core purpose has graduated from financial inclusion to inclusive banking.

Let us understand more about Bandhan Bank.

Bandhan Bank Company Overview

Bandhan was set up in 2001 as a not-for-profit entity with the objective of financial inclusion and women empowerment through sustainable livelihood creation. It started its microfinance operations from Bagnan, a small village about 60 km from Kolkata. The model followed for delivering microfinance services was individual lending through group formation. Bandhan focused on serving under-banked and underpenetrated markets.

In 2006, Bandhan acquired a Non-Banking Financial Company (NBFC) and created Bandhan Financial Services Private Limited (BFSPL) to scale up its microfinance activities. 2010 it became the country’s largest microfinance institution (MFI).

In April 2014, Bandhan received in-principle approval from the Reserve Bank of India (RBI). On June 17, 2015, RBI granted the banking license to Bandhan, making it the first-ever microfinance institution to become a universal bank in India.

Bandhan Bank commenced operations on August 23, 2015. The then Union Finance Minister, Late Shri Arun Jaitley, inaugurated the Bank in Kolkata. Its public shareholders then included the International Finance Corporation; Caladium Investment Pte Ltd (Singapore’s sovereign wealth fund, an arm of GIC); and the Small Industries Development Bank of India (SIDBI).

On 27 March 2018, Bandhan Bank was listed on the bourses and became the 8th largest bank in India by market capitalization on the day of listing itself.

Bandhan Bank Journey

The timeline below depicts the Bank’s journey since inception and the most important events contributing to its growth and success.

  • 2001: Bandhan started as a society for financial inclusion and women’s empowerment through sustainable livelihood creation. Started microfinance operations in rural Bengal.
  • 2006: Bandhan acquired an NBFC and established Bandhan Financial Services Limited – keeping the core objective of financial inclusion intact
  • 2009: The microfinance portfolio was transferred from society to NBFC
  • 2010: Bandhan became the largest microfinance institution (MFI) in the country
  • 2015: Bandhan Bank started operations as a universal bank on August 23. It became the first microfinance company in India to get a universal banking license. On the day of the launch, the bank started with 2523 banking outlets
  • 2018: On the day of listing, Bandhan Bank emerged as the 8th most valued bank based on market capitalization
  • 2019: Bandhan Bank acquired the stake of HDFC Limited in GRUH Finance, one of India’s most affordable housing companies.
  • 2020: The bank set up its 1000th bank branch  and 4000th booking outlet
  • 2021: Crossed the milestone of INR 1,50,000 crore in total business

Bandhan Bank Management Profile

  • Mr. Chandra Shekhar Ghosh: CEO and Managing Director – Chandra Shekhar Ghosh is the visionary founder of Bandhan Bank. He was crucial in establishing Bandhan as a microfinance institution and later converting it into a scheduled commercial bank. He has been recognized by esteemed enterprises for his exemplary work. 
  • Mr. Ratan Kumar Kesh: Chief Operating Officer – Mr. Ratan has over 27 years of experience across industries in leadership roles. During his tenures at ICICI Bank, HDFC Bank, Yes Bank, and Axis Bank, he led organizational transformations focusing on technology, digitalization, governance, quality, and customer satisfaction.
  • Mr. Sunil Samdani: Chief Financial Officer – Mr. Samdani spearheads the functions of Finance, Investor Relations and Business Intelligence. In his experience of over 23 years in financial services, he has handled multiple roles within the finance and strategy functions. Before joining Bandhan Bank as CFO, Mr. Samdani held important positions like the Head of Business Analytics and Strategy at Development Credit Bank and CFO at Karvy Financial Services Ltd.
  • Mr. Shantanu Banerjee: Head of Human Resources – Mr. Banerjee leads human resources, training, and legal. In his previous role, he was Head of HR – Business Relationships at Axis Bank. He was responsible for the strategic interface of Corporate HR with all business verticals at Axis Bank. He has over 25 years of experience in the banking and finance industry.
  • Mr. Biswajit Das: Chief Risk Officer – Mr. Das spearheads the Risk Management for the Bank, including Information Security. He has around three decades of experience in the Banking sector, spanning areas like Risk Management and Governance, Business Development, Strategy, Post-merger integration, Process Excellence, and Service Quality. His last assignment was as Head – Risk Based Supervision and Regulatory Reporting at ICICI Bank.

Bandhan Bank Shareholding Pattern

image 14
Source: BSE India

Bandhan Bank Business Segments

Bandhan Bank started with microfinance lending but has adopted a strategy of diversification to de-risk itself from the highly risky MFI segment. The bank now operates in the following segments:

  1. Microfinance lending
  2. Housing Finance
  3. Commercial banking
  4. Retail finance
image 15
Source: Bandhan Bank Q1FY24 Results

Note:* EEB is Emerging Entrepreneurs Business, including micro loans, home loans, micro bazaar loans, and micro-enterprise loans. SBAL is Small Business & Agri Loans.

Bandhan Bank is looking to do more secured lending and reduce exposure to the MFI segment as a conscious strategy. The Bank wants to raise secured lending to 70% of the loan book by March 2025.

Bandhan Bank Financials

Core Operating Profit and Net Profit

Bandhan Bank registered a net profit of INR 721 Cr during Q1FY24 against a net profit of INR 887 Cr in Q1FY23. Net interest income (NII) in Q1FY24 came in at INR 2,491 Cr, broadly similar to INR 2,514 Cr delivered during Q1 FY23. PAT in Q1FY24 was reduced due to higher slippages, other expense growth, and income reduction.

Particulars (In INR Cr)Q1FY24Q4FY23QoQ%Q1FY23YoY%
Interest Income4,522.94,268.35.97%4,055.411.53%
Interest Expense2,032.31,796.513.14%1,540.931.87%
Net Interest Income (NII)2,490.62,471.80.77%2,514.5-0.93%
Non-Interest Income385.1629.1-38.79%329.816.78%
Net Total Income2875.73100.9-7.26%2844.31.12%
Operating Expenses1,313.41,305.30.61%1,023.628.29%
Operating Profit1,562.31,795.7-12.97%1,820.6-14.15%
Provision (Std. + NPA)602.1734.8-18.10%642.4-6.29%
Profit Before Tax960.21,060.9-9.43%1,178.2-18.44%
Tax239.2252.6-5.14%291.7-17.72%
Profit After Tax721.0808.3-10.77%886.5-18.97%
Source: Bandhan Bank Q1FY24 Results

Net Interest Income & Net Interest Margin

Net Interest Income (NII) is the difference between the interest earned on a bank’s assets (such as loans and investments) and the interest paid on its liabilities (such as deposits and borrowings).

Net Interest Margin (NIM) is calculated by dividing the NII by the average interest-earning assets.

NIM has remained stable in the 7-8% range for the last four years, from FY20 to FY23. Bandhan Bank delivered a NIM of 7.3% in Q1FY24. NIM range is higher for Bandhan vs. other banks due to the nature of high-risk lending that it does, especially in the micro-finance segment.

NII, however, has grown significantly from INR ~4,500 Cr in FY19 to INR 9,260 Cr in FY23 on the back of an increase in loan book while maintaining the NIMs in the 7-8% range.

image 16
Source: Bandhan Bank Annual Reports FY20-FY23

Asset Quality

NPA stands for Non-Performing Asset. It refers to a loan or an advance where the borrower has not paid the interest or the principal amount for a specified period, usually for 90 days or more.

Gross NPA refers to the total value of a bank’s non-performing assets. Net NPA, on the other hand, is the value of NPA after reducing the provisions made by the bank to cover the losses that may arise from such non-performing assets.

Bandhan Bank operates in the high-risk micro-finance segment where NPAs are traditionally very high, hence the high lending rate. NPAs went up significantly during COVID-19, as seen in the chart below. However, GNPA and NNPA have improved from FY21, driven by improved collection and recovery post-Covid.

For Q1FY24, GNPA/NNPA ratios deteriorated 189bn/101 bp to 6.8%/2.2% primarily due to ECLGS (Emergency Credit Line Guarantee Scheme) covered advances amounting to INR 5.8 bn being classified as NPA as per RBI Circular.

Note: The ECLGS scheme was launched as a part of the Atma Nirbhar Bharat package for the Micro, Small, and Medium Enterprises (MSME) borrowers to mitigate the distress caused by the COVID-19 pandemic.

image 17
Source: Bandhan Bank Annual Report FY23

Advances & Deposits

An advance refers to a loan or credit extended by a bank to its customers. Banks offer various advances such as personal, business, home, education, vehicle, and credit card loans.

Advances grew to INR 1031.7 bn in Q1FY24, led by solid Non-MFI (Microfinance) portfolio growth. The MFI book declined 12% YoY to INR 513 bn in Q1FY24, decreasing the MFI share in the total book to 50% from 60% in Q1FY23.

Deposits are a critical source of funding for banks, and they use these funds to provide loans and advances to customers.

Deposits grew 16.6% YoY to INR 1084.8 bn in Q1FY24, led by 31% YoY growth in Term Deposits, while CASA (Current Account & Savings Account) declined 8% QoQ due to the rundown of one large account. CASA ratio declined 330 bp QoQ to ~36%. The retail deposit mix was steady at 71% in Q1FY24.

image 18
Source: Bandhan Bank Annual Report FY23

Return on Asset

Bandhan Bank has seen its ROA (A higher RoA suggests that a bank is more efficient in generating profits from its assets) reduce to 0.22% in FY22 due to Covid-related losses from ~4%+ in FY19 and FY20.

This has started to improve in FY23 and is expected to keep improving due to reduced provisions & NPA, growth in the Non-MFI loan book, and improvement in NIMs.

image 19
Source: Bandhan Bank Annual Reports FY20-FY23

Bandhan Bank Share Price History

Bandhan Bank currently stands at a Market Capitalisation of INR 36,881 Cr (as of 4th July 2023), while the same at the time of IPO was at INR ~57,000 Cr in March 2018.

The stock has been correcting since then, and its five-year share price CAGR has been -20% (from 4th July 2018 to 4th July 2023). This has been chiefly due to the challenging external environment and the unsecured nature of lending done by Bandhan Bank.

However, the financial situation is improving now and is expected to improve as the economy grows. The share price is accordingly likely to do well.

image 20
Source: TradingView

Bandhan Bank

Bandhan Bank has had to face many challenges due to the unsecured nature of its lending. The Bank is now diversifying and working to achieve 70% secured lending by FY25. This should reduce the risk and provide better growth opportunities for the bank.

The bank’s operations have primarily been in the country’s West Bengal and North East regions. However, the bank is looking to grow actively outside these geographies with a sharp focus on the Small Business and Agri Loans segment.

Bandhan Bank is also looking to scale its housing business aggressively after acquiring Gruh Finance. This should further diversify the loan book and allow Bandhan Bank to expand using Gruh’s existing branch network.

Key risks:

  • More than expected stress arising out of the EEB book (Emerging Entrepreneurs loan book), which is mostly unsecured loan
  • Less than expected loan growth going forward
  • External shocks like Covid-19 can have severe consequences on the health of the bank

*Disclaimer Note: The securities quoted, if any, are for illustration only and are not recommendatory. This article is for education purposes only and shall not be considered as recommendation or investment advice by Research & Ranking. We will not be liable for any losses that may occur. Investment in securities market are subject to market risks. Read all the related documents carefully before investing. Registration granted by SEBI, membership of BASL, and certification from NISM in no way guarantee the performance of the intermediary or provide any assurance of returns to investors.

FAQs

What is the 52 Week High and Low of Bandhan Bank?

52 Week’s high of Bandhan Bank is INR 314.75, and 52 Week low of Bandhan Bank is 182.2 per share.

What is the face value of the share of Bandhan Bank Ltd.?

The face value of Bandhan Bank’s share price is INR 10 per share.

Introduction Talk about lubricants, and Castrol is one brand that immediately comes to mind. This 100-year-old brand is the market […]

Introduction

Talk about lubricants, and Castrol is one brand that immediately comes to mind. This 100-year-old brand is the market leader in its segment and continues to be a cash-generating machine. However, the share price of Castrol has delivered inferior returns for its shareholders in the last ten years.

Let us understand more about Castrol India

Castrol India Overview

Castrol India made its debut in the Indian market in 1910, with its first branch office located in Bombay. Castrol India Ltd is a subsidiary company of Castrol (a global leader in lubricants, part of BP group) that produces and distributes lubricant products, including premium lubricating oils and greases, antifreeze and coolant, engine oils, compressor oils, and more.

Castrol has leadership positions in most segments, including passenger car engine oils, 4-stroke motorcycle engines, and multi-grade diesel engines. Castrol offers a range of favored brands, including Castrol CRB, Castrol GTX, Castrol Activ, Castrol MAGNATEC, and Castrol VECTON. Millions of consumers and customers trust these brands throughout the country.

Additionally, the company operates in specialized markets such as High-performance Lubricants and metalworking fluids, which are used in various industries, including automotive manufacturing, mining, machinery, and wind energy.

Castrol has an extensive manufacturing and distribution network in India, with three manufacturing plants in Silvassa, Patalganga, and Paharpur and a distribution network of 420 distributors who serve customers through over 105,000 retail outlets. Castrol also serves its customers through exclusive outlets, including Castrol Bike Points, Castrol Pitstops, Castrol Rural Outlets, and Castrol Authorized Service Associates (CASAs).

Castrol India Company Journey

Castrol India has had a long and illustrious history. Here are some of the critical milestones in the company:

  • 1910: C.C. Wakefield’s automobile lubricants were introduced in the Indian market
  • 1919: C.C. Wakefield sets up a branch office in Bombay, its first overseas branch
  • 1960: C.C. Wakefield changed its name to Castrol Ltd. The Indian branch’s name changes accordingly
  • 1961: Manufacturing operations have commenced in India at a blending plant in Wadala, Mumbai.
  • 1966: Burmah Oil acquires Castrol globally
  • 1979: Indian branch incorporated with a new name, Indrol Lubricants & Specialties Pvt Ltd
  • 1983: Indrol becomes a public limited company, with Castrol UK holding 40% equity
  • 1990: Indrol Lubricants changes its name to Castrol India Ltd
  • 2000: BP takes over Burmah Castrol. Castrol India becomes part of the BP Group

Castrol India Management Profile

Mr. R Gopalakrishnan has been the Chairman of Castrol India since 17 October 2000. He is also an Independent Director & Non-Executive Chairman of Castrol India. He has extensive corporate experience of nearly 55 years, of which 31 years were with Hindustan Lever Limited (HLL) / Unilever and 18 years were with Tata Group. He has a rich experience of over 34 years of serving across the boards of several companies. He studied physics at St. Xavier College, Kolkata, and did his engineering at the Indian Institute of Technology (IIT), Kharagpur. Later, he completed an Advanced Management Program at Harvard Business School, USA.

Mr. Sandeep Sangwan has been the Managing Director of Castrol India since January 2020. Before joining the Company, he worked with Gillette and P&G for over 20 years in India, the Middle East, China, and Europe, where he held several leadership roles in sales, marketing, and P&L delivery. He is an alumnus of the Indian Institute of Management (IIM), Lucknow, and Regional Engineering College (NIT), Kurukshetra.

Mr. Deepesh Baxi has been the Chief Financial Officer and Whole-time Director of Castrol India since 1st January 2021. Deepesh is also responsible for strengthening relationships with CIL’s investors, analysts, and bankers. Before this role, Deepesh worked as a Financial Controller for Castrol’s global business. Deepesh is a Chartered Accountant awarded CXO of the Year in January 2020 by the Institute of Chartered Accountants of India (ICAI). He is an alumnus of the Indian Institute of Management (IIM) Ahmedabad and holds a Certified Internal Auditor (CIA) certification from the Institute of Internal Auditors, USA.

Mr. Mayank Pandey has been the whole time Director of Castrol India since 09 August 2021. Mayank Pandey has over 20 years of industry experience, of which he has spent the last 14 years at BP, having joined Castrol in September 2007. Mayank heads the supply chain operations for India. He is responsible for developing and implementing a robust Supply Chain strategy to enable business growth for Castrol India and operate a safe, reliable, and efficient supply chain. Mayank has an MBA from the SP Jain Institute of Management and a Mechanical Engineer from the Harcourt Butler Technological Institute. 

Castrol India Shareholding Pattern

image 162
Source: BSE India

Castrol India Company Analysis

India’s lubricant market operates in three broad segments: Automotive, Industrial, and Marine. All three segments include players from National Oil Companies, international oil majors, and several local companies.

Castrol India Limited operates across all three segments and holds a leading position in retail automotive, with a notable presence in specialized industrial fluids.

Castrol India is keen to support the transition to electric vehicles (EVs) within the automotive lubricant segment. It is working with its industry partners to bring forth the next generation of technologies while diversifying its traditional lubricants business.

The sales of electric vehicles (EVs) in India currently account for less than 1% of total new car sales (Source: SIAM). Considering that the penetration of cars in India is still low and is poised to grow further, the Company foresees continued demand for internal combustion engines (ICE) vehicles till 2040, alongside EV market growth.

Castrol India Fundamentals

The core business of Castrol India is to manufacture and distribute automotive and industrial lubricants in the market. Castrol India benefits from its parent company, Castrol Worldwide, which operates in more than 120 countries, providing access to global technology innovations and management expertise. Additionally, Castrol India is a reliable supplier to OEMs such as Maruti Suzuki, Tata Motors, Mahindra, JCB, Audi, and Bosch.

Castrol is exploring opportunities to provide solutions and services to complement its core lubricants business. So, Castrol India made some strategic decisions to grow its business, like entering into partnerships with auto companies to add incremental volume growth, expanding its presence in service and maintenance space, increasing Castrol Auto service (CAS) outlets to over 300 across about 100 cities in India, and have 5,000 Castrol bike point across India.

Castrol and Mahindra Insurance Brokers recently announced an alliance for Castrol auto service workshops. The offer will allow Castrol Auto Service (CAS) workshops to distribute eligible vehicle insurance policies, and suitable CAS workshops will be able to register as cashless claim sites with leading insurance companies.

Castrol India is also expanding its portfolio into the Auto care segment with various products. Their new range of products includes Castrol chain cleaner, Castrol chain lube, Castrol 3-in-1 shiner, Castrol 1-Step Polishing Compound, and Castrol Anti-Rust Lubricant Spray.

Revenue and Profitability

Castrol has struggled to deliver revenue and profit growth over the last decade. For the first quarter (Q1) ended 31 March 2023, the Company registered Revenue from Operations of INR 1,294 Cr., marking a growth of 5% compared to INR 1,236 Cr in 1Q 2022 (corresponding quarter in the previous year) and an increase of 10% from INR 1,176 Cr in 4Q 2022 (last quarter).

Sales growth CAGR for CY18 to CY22 has been a modest 5.15%. Profit before Tax for 1Q 2023 stood at INR 288 Cr, a drop of 7% compared to INR 311 Cr in 1Q 2022 and 16% higher than INR 248 Cr in 4Q 2022. Net PAT growth CAGR for CY18 to CY22 has been a mere 3.58%, even less than the sales growth.

image 163
Source: Castrol India Annual Report CY22 and Investor Presentation March 2023

Return on Capital Employed:

While the growth has been modest, the company delivers 35%+ ROCE yearly. Although the ROCE has reduced from 50%+ odd levels in CY18 to 37% in CY22 due to the reduction in margins, it remains pretty high.

The company is cash-rich and consistently delivers high operating cash flow. That is why it has very low borrowing and, hence meager debt-to-equity ratio. It uses its cash reserves to pay handsome dividends to shareholders.

image 164
Source: Capital IQ

Castrol India Share Price History

While Castrol India is highly profitable, cash flow generating, and pays enormous dividends, the stock price performance has been dismal over the last ten years.

10-year share price CAGR has been -1%. The stock was trading around INR 160 per share on 30th July 2013 and trades at around INR 145 as of 27th July 2023. One of the reasons for the dismal performance of the stock price can be attributed to the low growth in revenue and profitability of the business.

image 165
Source: TradingView

Castrol India Strengths & Risks

Castrol has always enjoyed its brand legacy, and it will be able to secure its profitability with a better product mix, cost control, and the launch of advanced products with better realization in the future. Some of the positive triggers for the stock going forward are:

Lubricant demand is expected to grow at low to low-single digits in the next couple of years, led by higher demand from the personal mobility space and a revival in demand from CVs on account of overall recovery in the Indian economy.

Castrol India is expanding into new areas, such as Castrol Auto Services, and forming partnerships, like the one with Jio-BP (which may necessitate additional investment). These strategic moves are expected to help the company gain market share.

Strong demand from personal mobility and a potential revival in the CV and industrial segments would help boost Castrol’s lubricant sales volumes. At the same time, margins are expected to remain healthy, led by better realizations and operating leverage.

Electrification trend: EVs also require transmission fluids, greases, and coolants, and Castrol could cater to the EV segment and explore new business opportunities while strengthening its existing business in ICE.

Key risks:

  • Lower-than-expected lubricant volume in case of economic slowdown.
  • Possibility of impact on margins in case of a sharp rise in crude oil prices.
  • Long-term sales may reduce as the share of Electric Vehicles starts increasing.

*Disclaimer Note: The securities quoted, if any, are for illustration only and are not recommendatory. This article is for education purposes only and shall not be considered as recommendation or investment advice by Research & Ranking. We will not be liable for any losses that may occur. Investment in securities market are subject to market risks. Read all the related documents carefully before investing. Registration granted by SEBI, membership of BASL, and certification from NISM in no way guarantee the performance of the intermediary or provide any assurance of returns to investors.

FAQs

Is Castrol India good to buy for the long term?

Castrol India’s share price has not done well in the past due to the absence of growth in the business, both at the revenue and profit level. One must ensure there is visibility of growth before investing in Castrol. Additionally, entry valuation must be at a reasonable margin of safety to provide a cushion against future risks.

What is the face value of Castrol India Share?

The face value of Castrol India is INR 5 per share.

What is the Market cap of Castrol India?

The market cap of Castrol India is INR 12,868 crores as of 18th July 2023.

Read more:  How Long-term investing helps create life-changing wealth – TOI.

Introduction Wipro is no ordinary company, taking its first step on its journey in 1945 when the world was recovering […]

Introduction

Wipro is no ordinary company, taking its first step on its journey in 1945 when the world was recovering from the aftermath of World War II. It started as a humble family-run commodity-based vegetable oil maker to a professionally managed, diversified global corporation renowned for its expertise in IT, consultant, and business process services.

This article will dive deep into Wipro and explore the potential growth of Wipro share price.

Overview of Wipro

Wipro was started 1945 by Mohamedhusain Hasham Premji, who took over his late father’s grain trade business and established an oil mill known as Western India Vegetable Products.

For the next two decades, the company solely focused on growing its vegetable-based oil business. After the untimely death of Mohamedhusain Hasham Premji at age 51, his son, Azim Premji, took over the business and started working to transform it into a brand-oriented company, leaving behind its legacy as a vegetable oil maker.

Azim Premji re-registered the company as Wipro, which paved the way for diversification into various other industries. In August 1979, Wipro entered the Infotech division, and by 1989, it had successfully diversified into manufacturing computer systems, computer products, and industrial equipment.

After the Indian market opened in the 1990s, Wipro made a significant foray into IT services, propelling its growth and ultimately becoming a billion-dollar company by 2000.

The company is now one of the leading IT solution service providers for companies worldwide, with a workforce of over 250,000 employees in over 66 countries. As of 22nd July 2023, its market cap stands at ₹2.2 lakh crores.

Wipro Company Analysis

The businesses are organized into the following three operating segments:

IT Services

It is the biggest business unit for Wipro in terms of revenue and is divided into four Strategic Market Units (SMUs).

  • Americas 1: It includes the entire business of LATAM (Latin America) and encompasses several industry sectors in the USA, including healthcare and medical devices, consumer goods and life sciences, retail, transportation and services, communications, media, and information services, as well as telecom products and platforms.
  • Americas 2: It includes the entire business operations in Canada and covers various sectors in the United States of America, such as banking, financial services, insurance, manufacturing, hi-tech, energy, and utility.
  • Europe: It includes business operations in the UK, Ireland, Switzerland, Germany,  Benelux, the Nordics, and Southern Europe.
  • APMEA: It includes revenues from Australia and New Zealand, India, the Middle East, South East Asia, Japan, and Africa.

IT Products

This segment includes revenue from the sale of hardware, software products, and other related deliverables. Wipro is a value-added reseller of security, packaged, and SaaS software for leading international brands.

ISRE

Indian Run State Enterprise (ISRE) generates revenue from the sale of IT Services offerings to entities and/or departments owned or controlled by the Government of India and/or any State Governments.

Wipro Key Management Personnel

  • Azim H Premji is the Founder Chairman and is a Non-Executive and Non-Independent Director.
  • Rishad Premzi is the Executive Chairman of Wipro Limited and joined the company in 2007. He works closely with Wipro’s leadership team providing direction and strategic insight to the business. Rishad has an MBA from Harvard Business School and pursued BA in Economics.
  • Mr. Thierry Delaporte is the CEO and Managing Director of Wipro Limited and has over 27 years of experience in the IT services industry. Before joining Wipro, he held various leadership roles, including COO at Capgemini. Mr. Thierry holds a bachelor’s degree in economy and finance and a Master of Law from Sorbonne University.
  • Mr. Amit Choudhary is the COO of Wipro Limited, and previously he was with Capgemini, where he was a COO for the company’s Financial Services Strategic Business Unit. He is an alumnus of IIT-Kanpur and IIM-Calcutta.
  • Mr. Jatin Dalal is the President and CFO of Wipro Limited and joined the company in 2002 and has worked in diverse roles in finance. He is a qualified CA, CMA, CFA, and Chartered Global Management Accountant.

Wipro Shareholding Pattern

image 142
*As of 30th June 2023

Wipro Financials

Revenue

In FY23, Wipro Limited reported a 14.3% growth in total revenue at ₹90,934 crores, from ₹79,528 crores in FY22. In Q1FY24, the company reported a marginal 6% growth in revenue at ₹22,831 crores, compared to ₹21,528 crores.

image 143

Revenue Breakup By Sector        

 FY22 (in  ₹ cr)FY23 (in  ₹ cr)Q1FY23 (in  ₹ cr)Q1FY24 (in  ₹ cr)
Banking, Financial Services, and Insurance26,97731,1847,5707,736
Health9,10510,5192,4292,788
Consumer13,64416,7643,9634,253
Communications3,8584,2371,0551,041
Energy, Natural Resources, and Utilities9,45810,2732,3782,735
Manufacturing5,3276,1461,4341,646
Technology9,37510,1752,5032,559
IT Products617.3604.7194.669.4
ISRE729.5582.3

Operating Margin

Wipro Limited earns over 90% of its revenue from the IT Services segment. In FY23, the company’s operating margin from the segment was 15.7%, down from 17.7% in FY22. In Q1FY24, the company reported an operating margin of 16%, up from 14.9% in Q1FY23.

image 145

Net Profit

In FY23, Wipro Limited posted a 7.1% decline in net profit at ₹11,350 crores from ₹12,219 crores in FY22. And, in Q1FY24, the company posted a 12.8% growth in net profit at ₹2,886 crores, from ₹2,558 crores in Q1FY23.

image 146

The net profit margin declined to 13.45% in FY23 from 20.37% in FY22.

Wipro Key Financial Ratios

  • Current Ratio: Wipro’s current ratio on 31st March 2023 was 2.86 times, up from 2.23 times at the end of FY22.
  • Debt-to-equity Ratio: At the end of 31st March 2023, the company debt-to-equity ratio was 0.10 times, down from 0.16 times in the last 12 months.
  • Return on Capital Employed (ROCE): ROCE for FY23 was 18.75%, down from 25.01% in FY22.
  • Net Income Margin: In FY23, the company’s net income margin declined to 12.5% from 15.4% in FY22.

Wipro Share Price History

As per the company website, Wipro’s initial public offering was in 1946, and in October 2000, it listed its shares on New York Stock Exchange. It raised approximately $131 million in its US IPO, offering its American Depositary Shares (ADS).

Wipro

As of 22nd July 2023, Wipro share price has given a CAGR return of 15% in the last three and five years. It reached an all-time high level of ₹739.85 on 11th October 2021. The company has a consistent track record of paying dividends to its shareholders. In the last three years, it has paid ₹1 in 2021, ₹5 in 2022, ₹1 in 2023 as dividends.

Its shares were split twice, once when it brought down the face value of shares from ₹100 to ₹10, and in September 1999, bringing down the face value to ₹2.

In addition, the company has undertaken numerous bonus issues over the past several years. To be precise, the company has implemented 13 bonus issues since 1971, as per data from moneycontrol.com.

Wipro Fundamentals

Over the past few years, Wipro Limited has faced a consistent challenge with declining operating margins. Additionally, the company has been unable to meet its revenue guidance for the last seven consecutive quarters. These factors have played a significant role in the underperformance of Wipro’s share price compared to the Nifty 50 index.

The primary cause for the decline in operating margin is reducing discretionary spending by customers due to uncertain macroeconomic conditions, which has also affected the closure of new deals as the company failed to increase the count of new clients in the $100+ million category in FY23. Its free cash flow to net income percentage in FY23 is 102.3%, indicating the company’s robust financial health. At the end of 31st March 2023, the company had net cash of ₹25,101.9 crores in its book.

Steady Deal Momentum

Despite the headwinds, the company can close large deals. In Q1FY24, Wipro won total deals worth $3.7 billion. There is a strong demand for Cloud Transformation among clients and newer technologies, especially AI.

Moderating Attrition Rate

Wipro’s employee attrition rate moderated to 17.1% in the latest quarter, compared to 23.3% in Q1FY23, which is positive for the company. It also trains its employees in emerging technologies like AI, which is in great demand. The company will invest $1 billion over the next three years in the organic development of generative AI technologies.

Share Buyback

Wipro has recently concluded its ₹12,000 crores share buyback program, the largest in its history. It bought back 20.95% of the fully paid-up equity share capital or 26.97 crores of equity shares at a price of ₹455.

Wipro Share Price Growth Potential

The Indian IT sector is expected to witness a decline in revenue growth by 700 to 900 bps in FY24, owing to global macroeconomic and financial sector slowdown, according to the CRISIL report. Customers across IT companies are now focusing more on curbing discretionary spending and vendor consolidation on deals.

Wipro, being significantly reliant on the BFSI sector in the US and Europe (accounting for over 30% of its revenue), will likely face challenges in earnings growth due to headwinds in this segment.

Also, the slowdown in IT spending is attributed to a strong demand uptick during the pandemic, which is now normalizing.

In the first quarter of FY24, Wipro missed its revenue growth guidance and has since revised it even lower, with expectations ranging from -2% to 1% for the second quarter. This lackluster performance could add pressure to Wipro share price in the short term.

Despite these near-term challenges, the long-term outlook for the Indian IT sector remains buoyant and robust. According to NASSCOM’s report “Strategic Review 2023 – Priming For A ‘No Normal’ Future,” India’s technology sector is projected to double its revenue to $500 billion by 2030, indicating significant growth potential.

Moreover, historical data shows that the Indian IT sector has delivered substantial returns over the long term. As of June 30, 2023, the Nifty IT Index has recorded an impressive CAGR price return of 16.14% over the last five years. This shows the sector’s resilience and potential.

*Disclaimer Note: The securities quoted, if any, are for illustration only and are not recommendatory. This article is for education purposes only and shall not be considered as recommendation or investment advice by Research & Ranking. We will not be liable for any losses that may occur. Investment in securities market are subject to market risks. Read all the related documents carefully before investing. Registration granted by SEBI, membership of BASL, and certification from NISM in no way guarantee the performance of the intermediary or provide any assurance of returns to investors.

FAQs

When was Wipro established?

Wipro was established in 1945 and was originally a vegetable oil manufacturer by  Mohamedhusain Hasham Premji. It diversified into the Infotech division in 1979 and forayed into the IT Services market in the early 1990s under the leadership of Azim Premji.

How has Wipro share price performed in the last 5 years?

Over the past five years, Wipro share price has delivered a CAGR return of 15%. It reached an all-time high of ₹739.85 on 11th October 2021.

Who is the CEO of Wipro Limited?

Mr. Thierry Delaporte is the CEO and Managing Director of Wipro Limited and was previously with Capgemini as Chief Operating Officer.

No more posts to show

Frequently asked questions

Get answers to the most pertinent questions on your mind now.

An investment advisory firm is a company that helps investors make decisions about buying and selling securities (like stocks) in exchange for a fee. They can advise clients directly or provide advisory reports and other publications about specific securities, such as high growth stock recommendations. Some firms use both methods, like Research & Ranking, India’s leading stock advisory company, specializing in smart investments and long-term stocks since 2015.

An investment advisory firm is a company that helps investors make decisions about buying and selling securities (like stocks) in exchange for a fee. They can advise clients directly or provide advisory reports and other publications about specific securities, such as high growth stock recommendations. Some firms use both methods, like Research & Ranking, India’s leading stock advisory company, specializing in smart investments and long-term stocks since 2015.
What is an Investment Advisory Firm?

An investment advisory firm is a company that helps investors make decisions about buying and selling securities (like stocks) in exchange for a fee. They can advise clients directly or provide advisory reports and other publications about specific securities, such as high growth stock recommendations. Some firms use both methods, like Research & Ranking, India’s leading stock advisory company, specializing in smart investments and long-term stocks since 2015.

An investment advisory firm is a company that helps investors make decisions about buying and selling securities (like stocks) in exchange for a fee. They can advise clients directly or provide advisory reports and other publications about specific securities, such as high growth stock recommendations. Some firms use both methods, like Research & Ranking, India’s leading stock advisory company, specializing in smart investments and long-term stocks since 2015.

An investment advisory firm is a company that helps investors make decisions about buying and selling securities (like stocks) in exchange for a fee. They can advise clients directly or provide advisory reports and other publications about specific securities, such as high growth stock recommendations. Some firms use both methods, like Research & Ranking, India’s leading stock advisory company, specializing in smart investments and long-term stocks since 2015.

An investment advisory firm is a company that helps investors make decisions about buying and selling securities (like stocks) in exchange for a fee. They can advise clients directly or provide advisory reports and other publications about specific securities, such as high growth stock recommendations. Some firms use both methods, like Research & Ranking, India’s leading stock advisory company, specializing in smart investments and long-term stocks since 2015.

Who we are

SEBI registered investment advisory services

Media, Award & Accolades

Stay updated with our winning journey

Video Gallery

Watch our exclusively curated financial videos

Performance

Know the journey of stocks

Newsletters

Stay on top of the stock market

Contact us

Stay in touch

5 in 5 Strategy

A portfolio of 20-25 potential high-return stocks

MPO

1 high-growth stock recommendation/ month, that is trading below its intrinsic value

Combo

A combined solution of 5-in-5 wealth creation strategy & mispriced opportunities

Dhanwaan

Manage your portfolio with dhanwaan

Informed InvestoRR

A step by step guide to sharpen your investing skills

EPW Coming soon

A concentrated portfolio of 12-18 high-growth & emerging theme stocks

Pricing

Choose from our range of pricing packages