1. Home
  2. Blog
  3. Fundamental Analysis of Stocks
  4. Page 3

Fundamental Analysis of Stocks

Know company background, financials, & more

Introduction Over the past two decades, there has been a notable transformation in India’s power market structure. Initially, state electricity […]

Introduction

Over the past two decades, there has been a notable transformation in India’s power market structure. Initially, state electricity boards (SEBs) and DISCOMs used to sign long-term power purchase agreements (PPAs) for 25 years with power generation plants.

These PPAs constituted the sole source for fulfilling a region’s energy demand. However, there was a significant limitation in this structure. Accurately predicting hourly power consumption over an extended period was challenging, resulting in power shortages in some areas and an excess power supply in others.

Furthermore, power generation plants entered into power purchase agreements (PPAs) structured with a cost-plus nature, which did not lead to competition in the sector.

Setting up of Power Exchanges

The enactment of the Electricity Act 2003 in May 2004 changed the dynamics of the power sector in the country. This legislation ushered in a new era for the power industry, introducing competitive elements across all segments and implementing inter-state power transmission that paved the way for a bilateral market.

In simpler terms, the act allowed power generators to sell surplus power to DISCOMs in different states and enabled DISCOMs to procure power from generators in other states.

In December 2006, the Central Electricity Regulatory Commission (CERC) released directives for establishing power exchanges in India. These exchanges created a unified platform for power buyers and sellers to engage in transactions and effectively determine prices.

The Establishment of the Indian Energy Exchange (IEX)

n March 2007, IEX applied to set up a power exchange. Following approval, IEX commenced operations on June 2, 2008, becoming India’s first power exchange.

The exchange was promoted by Financial Technologies India Ltd. and PFS. But, due to regulatory breaches, the promoter’s stake was divested and is now a professionally managed company. FTIL exited from the company in October 2015, and PFS in March 2017.

IEX’s Power Marketplace

IEX power exchange only represents the short-term electricity markets in India and covers contracts of less than one year of electricity supply. Unlike other commodity exchanges such as MCX, where you can profit from trading commodities without taking delivery, delivering power is mandatory on IEX. The company’s electronic trading platform comprises the following contracts:

  • Day-Ahead-Market (DAM): Electricity contracts in blocks of 15 minutes are offered the next day starting from midnight.
  • Green Day-Ahead-Market (G-DAM): It offers a collective auction in renewable energy on the day before the market. Bids for conventional and renewable sources are done in an integrated way through separate bidding windows.
  • Term-Ahead-Market (TAM): This includes electricity contracts for fixed terms in the future, including intra-day contracts, day-ahead contingency contracts, and contracts up to 11 days ahead.
  • Green Term-Ahead-Market (G-TAM): It is a market segment of TAM for trading in renewable energy.
  • Real-Time Market (RTM): Electricity contracts in blocks of 15 minutes are offered for same-day delivery.
  • Renewable Energy Certificates: This mechanism allows the state utilities and authorized entities to purchase renewable energy.
  • Energy Savings Certificates: In DAM and RTM, IEX has a market share of more than 99%, and in FY23, the overall electricity market share in DAM, TAM, RTM, and Green Market was 88.3%.

Key Management Personnel

  • Mr. Satyanarayan Goel is the Chairman and Managing Director of the company, having joined it as MD & CEO on January 21, 2014. He has over 40 years of experience in the power sector and was actively involved in various power sector reform initiatives of the Government of India, including the draft preparation of the Electricity Act 2003, Tariff-based Bidding Guidelines, Tariff Policy, National Electric Policy, and so on. Mr. Goel previously worked for PTC India Limited and NTPC. He graduated from NIT Rourkela with a bachelor’s degree in electrical engineering and an MBA from FMS Delhi.
  • Mr. Vineet Harlalka is the company’s Chief Financial Officer and Company Secretary. On January 16, 2010, he was named Company Secretary; on May 9, 2014, he was named CFO. Mr. Harlalka is a Chartered Accountant who is also a member of the Institute of Company Secretaries of India. He has over 20 years of experience in finance and taxation and previously worked for New Holland Fiat (India) Limited before joining IEX.
  • Mr. Amit Kumar is the Head of Market Operations and new Product Initiatives. He holds a B.Tech in Chemical Engineering from the Indian Institute of Technology (BHU), Varanasi. Mr. Kumar has an MBA from the Indian School of Business, Hyderabad.

IEX Shareholding Pattern

image 5
IEX-Shareholding-Pattern-as-on-June-30-2023.pdf

Financials of IEX

Revenue

IEX’s consolidated revenue declined by 2.1% on a Y-o-Y basis, from ₹484.4 crores in FY22 to 474.1 crores in FY23. In Q1FY24, consolidated revenue increased by 12.3% to ₹127.4 crores from ₹113.4 crores in Q1FY23.

image 9
Source: Annual-Report-FY-2020-21.pdf

EBITDA

In FY23, the company reported a marginal decline of 1.92% in EBITDA  year-on-year to ₹409.5 crores from ₹417 crores. And, in Q1FY24, EBITDA increased by 8.33% y-o-y to ₹104.9 crores from ₹96 crores.

image 7
Source: Annual-Report-FY-2020-21.pdf

Net Profit

In FY23, the company reported a marginal decline of 0.87% in net profit year-on-year to ₹305.9 crores from ₹308.6 crores. And, in Q1FY24, net profit increased by 9.7% y-o-y to ₹75.8 crores from ₹69.1 crores.

image 8
Source: Annual-Report-FY-2020-21.pdf
 FY19FY20FY21FY22FY23
PAT Margin (in %)56.159.8759.7463.3061.74

Key Financial Ratios of IEX

Current Ratio: At the end of FY23, the current ratio declined by 18.7% to 1.26 times from 1.54 times in FY22.

Return on Capital Employed (ROCE): The ROCE of the company improved to 53.45% in FY23 from 57.21% in FY22. The company has no long-term borrowing on its books. Therefore, the debt-to-equity and interest service coverage ratio is not reported.

IEX Share Price History

IEX launched its IPO in October 2017 with a total issue size of ₹1,000.73 crores at a price band of ₹1645 to ₹1650 per share and a face value of ₹10. The issue was an offer for sale (OFS) with existing promoters exiting the company.

IPO was oversubscribed by over 2.28 times, and shares were listed at ₹1,500, which was at a discount of 9.1%. On October 19, 2018, the stocks underwent a split in the ratio of 10:1. On October 21, 2021, the company issued bonus shares in the ratio of 2:1. Meaning that 100 shares allotted at IPO have now turned into 3000 shares.

 Face ValueRatioNumber of Shares
Pre-bonus and split share₹10100
Split- 19th Oct 2018₹1010:11000
Bonus Issue- 21st Oct 2021₹12:13000
Illustration

The company has a consistent track record of paying dividends to its shareholders. In the last three years, IEX paid ₹2.5 in 2020, ₹4 in 2021, and ₹3 as dividends.

image 4
Source: Trading View

IEX share price has given a CAGR return of 18% and 25% in the last five and three years, respectively, as of August 28, 2023. However, it has been underperforming the market for more than one year. It reached an all-time high of ₹318.65 after the split and bonus issue on October 19, 2021, and the price has declined. As of August 21, 2023, IEX had a market cap of ₹11,137 crores.

IEX Fundamental Analysis

IEX has a near monopoly in India’s short-term power trading markets with a debt-free balance sheet and strong cash flow from operations. The company is India’s most prominent and only listed power exchange, with an overall market share of 88%.

Electricity trading volume on the exchange has grown at a CAGR of 30% since 2008; in FY23, 96.8 billion units of electricity were traded on the exchange. As of June 2023, the company has a diverse user base of over 7,500 participants across utilities, industries, renewable generators, DISCOMs, and open-access consumers.

Competitive Advantage

IEX has a significant competitive advantage over its peers due to its first-mover advantage, significant network effect, innovative product portfolio, better pricing, and superior technology.

Power Exchange India Limited (PXIL), promoted by the NSE and NCDEX, and Hindustan Power Exchange (HPX) are other power exchanges competing with IEX. HPX is supported by the BSE, PTC India, and ICICI Bank.

Risks

Market Coupling: The Ministry of Power and CERC has decided to go ahead with market coupling, where an independent third party will collect buy and sell bids for short-term electricity contracts and, choose a uniform market price, and will be intimated to exchanges. This could end the monopoly of IEX, as other exchanges will feature the same price for all short-term electricity contracts. And could potentially reduce the profitability and market share of IEX.

Regulatory Changes: As electricity falls under the essential services category, the power sector in India is subject to various regulations and policies of central and state governments, which could impact the demand and supply, tariffs, and taxes. This could pose a considerable risk to IEX’s business model and profitability margins. For instance, short-term electricity prices in India are highly volatile, and in October 2021, they reached a record high of ₹20.79/kWh. The high price prompted the regulator to put a price cap of ₹12/kWh to protect customers and grid stability.

IEX Future Growth Outlook

In the short to medium term, IEX may experience headwinds and margin contraction due to the implementation of market coupling. However, launching innovative products like long-duration base contracts in power exchanges, future derivatives contracts, and the National Open Access Registry (NOAR) will likely positively impact IEX share price.

Despite the near-term headwind, the future outlook of the short-term electricity market in India is expected to grow and evolve in the coming years. According to the report India Energy Outlook 2021 by IEA, the share of the short-term electricity market is expected to grow from 10% in 2018 to 18% in 2040 and 21% in the sustainable development scenario.

Indian Gas Exchange (IGX)

IGX is a newly launched product from the house of IEX and is India’s first natural gas trading exchange. 50.9 million mmBTU natural gas was traded on IGX in FY23 across 2355 trades, representing a 319% year-on-year increase. The exchange has 40 members and over 200 active clients.

The government’s focus on increasing the share of natural gas in the total energy basket from ~6% to ~15% by 2030 and net zero carbon emissions by 2070 will lead to opportunities for gas exchanges & other players in the market.

International Carbon Exchange (ICX)

On the road towards further diversifying its product portfolio, IEX launched ICX in December 2022 to promote a voluntary carbon market where participants can trade their carbon credits. Almost 500 million units of carbon credits are traded globally, which is expected to grow to 1500-2000 million units by 2030. And, at present, only 25-30% of trades are happening over exchanges. This presents a massive opportunity for exchanges as demand for carbon credits skyrockets.

IEX is also exploring setting up a domestic coal exchange and has appointed consultants to finalize frameworks. With the rise of green energy systems, IEX may explore diversifying its product portfolio in the green markets, like trading green hydrogen and battery energy storage systems.

Besides the short-term electricity market, IEX has a largely untapped market that can propel its growth in the future. IEX has taken steps in that direction by establishing IGX, ICX, and an exploratory phase in establishing a coal exchange in India. IEX is well-positioned to meet the changing needs of the energy market as a fundamentally strong company with solid cash flows.

*Disclaimer Note: The securities quoted, if any, are for illustration only and are not recommendatory. This article is for education purposes only and shall not be considered as recommendation or investment advice by Research & Ranking. We will not be liable for any losses that may occur. Investment in securities market are subject to market risks. Read all the related documents carefully before investing. Registration granted by SEBI, membership of BASL, and certification from NISM in no way guarantee the performance of the intermediary or provide any assurance of returns to investors.

FAQs

What does IEX company do?

IEX, or Indian Energy Exchange, is a power exchange that facilitates trade in the short-term electricity market in India, where power generators and consumers (state electricity board, DISCOMs) can trade electricity as per the prevailing supply and demand.

When IEX was established?

IEX commenced operations on June 2, 2008, becoming India’s first power exchange.

How has IEX share price performed?

As of August 28, 2023, the IEX share price has given a CAGR return of 18% and 25% in the last five and three years, respectively.
Summary Gautam Adani’s rise to become one of India’s most successful industrialists in recent years can be traced back to […]

Summary

Gautam Adani’s rise to become one of India’s most successful industrialists in recent years can be traced back to the success of his ports and logistics company, Adani Ports & Special Economic Zone Ltd. Since its inception, the company has become a benchmark in India for efficiency in port operations and logistics management.

Adani Ports SEZ (APSEZ) is the central component of his business empire. Compared to his other businesses, this company is a cash cow playing a pivotal role in improving the country’s unorganized supply chain and logistics channels.

This article will look at the businesses of APSEZ and analyze its growth potential, including Adani Ports SEZ share price.

Overview of Adani Ports SEZ

The foundation of the Adani Ports was laid in 1995 when the Gujarat state government started inviting applications from private companies to set up and develop port projects as a joint venture.

Receiving the contract to develop Mundra Port on the northern shores of the Gulf of Kutch, Adani established Gujarat Adani Port Limited in 1998 as a joint-sector company. Initially promoted by Adani Port Limited and Gujarat Port Infrastructure Development Company, an undertaking company of the Gujarat government, the company began phase-wise operations in October 1998, with commercial operations starting in October 2001. Later, the Gujarat Government diluted its stake in Mundra Port and ultimately exited the JV.

Today, Adani Ports is India’s largest private port operator with a network of 14 ports and terminals, handling 24% of India’s cargo volumes together. Its Mundra port and Krishnapatnam port in Andhra Pradesh are ranked in the top 10 ports in India. Mundra Port has the highest annual cargo handling capacity of 250 MMT.

Special Economic Zone Business

The SEZ (special economic zone) unit was set up in 2003. It was incorporated as Mundra Special Economic Zone Limited -India’s first multi-product port-based SEZ and currently covers an area of over 15,000 hectares.

The SEZ allows different companies to set up manufacturing units of various products such as textiles, garments, plastics, chemicals, metal, engineering goods, and so on, and it benefits from different tax breaks such as exemption from excise duty, GST, and income tax.

It also offers warehousing and logistics services for the domestic and international markets through the Free Trade Warehousing Zone units, which allows duty-free storage and handling of goods. Mundra SEZ was merged with Adani Chemicals Limited in 2006, and its name was changed to Mundra Port and Special Economic Zone Limited (MPSEZ) before being renamed Adani Ports SEZ Limited in 2012.

Business Overview of Adani Ports SEZ

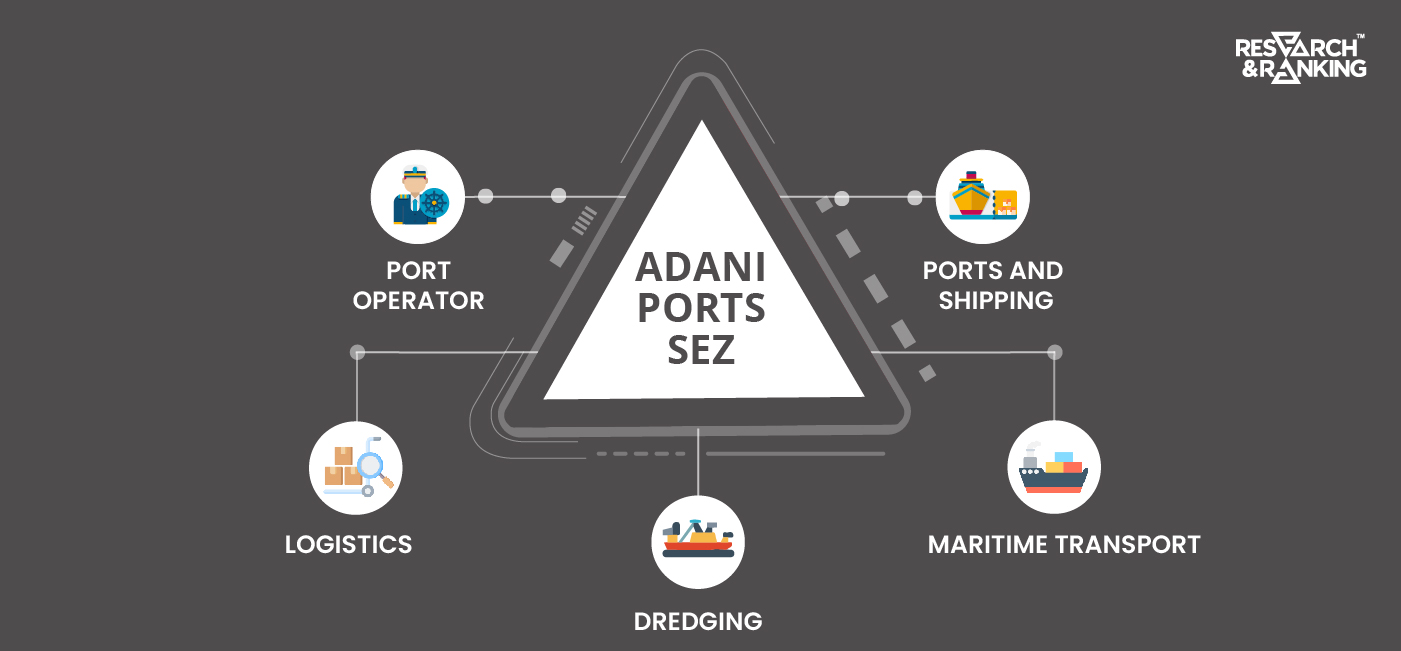
APSEZ consists of three business verticals- Ports, SEZ, and Logistics.

The company’s Ports business consists of 14 ports across the national coastline and two ports outside India in Colombo, Sri Lanka, and Haifa, Israel. It specializes in handling different types of cargo, such as crude oil, coal, food grains, and containers.

The SEZ vertical has an industrial land bank of 12,000 hectares at Mundra, Dharma, and Krishnapatnam, allowing companies to set up manufacturing and business facilities.

APSEZ is India’s largest integrated logistic player, with a private rail network, multi-modal logistics park (MMLP), and warehousing connecting ports to customer gates. It has the largest private rail network of 620 KM in India with 93 trains, 9 MMLP, 1.6 mn Sq. Ft. of warehousing and 1.1 MMT of grain silos.

Despite having a wide array of business activities, the company reports all its revenue under one segment, i.e., Port and SEZ activities. The operating activities are developing, operating, and maintaining the Ports services, Ports-related Infrastructure development activities, and development of infrastructure at contiguous Special Economic Zone.

Performance Creative 2

Build your well-diversified portfolio

Create wealth now!

Build your well-diversified portfolio

Create wealth now!

Key Management Personnel

  • Mr. Karan Adani is the CEO of APSEZ and is responsible for developing the Adani Group and overseeing its day-to-day operations. He holds a degree in economics from Purdue University, USA, and started his career at Mundra port in 2009, learning the intricacies of port business.
  • Mr. D. Muthukumaran is the Chief Financial Officer and joined the company in July 2022 from ReNew Power. He is a qualified chartered accountant and started his career at Deloitte in August 1992.

Shareholding Pattern

image 120
Source: APSEZ Website

Financials

Revenue

In FY23, consolidated revenue grew by 22% to ₹20,852 crores from ₹17,119 crores in FY22. The revenue grew by a CAGR of 19% in the last 10 financial years. Business-wise, revenue from logistics was ₹1,744 crores, and port business was ₹17,304 crores in FY23. And, in Q1FY24, revenue increased by 24% to ₹6,248 crores from ₹5,058 crores in Q1FY23.

image 121
Source: Investors-Presentation/AGM-Presentation-08-Aug-2023.pdf

EBITDA

During FY23, consolidated EBITDA increased by 21% to ₹12,833 crores from ₹10,607 crores. In FY23, the port business’s EBITDA was ₹12,039 crores, and the logistics business’s EBITDA was ₹487 crores. With around 70% EBITDA margin for the port business, APSEZ is the most profitable port operator globally.

In Q1FY24, the consolidated EBITDA increased by 80% to ₹3,765 crore from ₹2,089 crore in Q1FY23. During Q1FY23, the company recorded a forex loss of ₹1,201 crores, which pulled down its EBITDA.

image 122

EBITDA Margin

 FY19FY20FY21FY22FY23
EBITDA Margin (in %)6564646262

Net Profit

In FY23, APSEZ reported an approximately 9% annual increase in net profit to ₹5,393 crores from ₹4,953 crores in FY22. And, in Q1FY24, net profits increased by 80% y-o-y to ₹2,119 crores from ₹1,177 crores in Q1FY23.

image 123

Key Financial Ratios

Current Ratio: At the end of FY23, the current ratio declined by 7% to 1.36 times from 1.46 times in FY22.

Debt-to-equity Ratio: The debt-to-equity ratio improved marginally by 1% to 1.09 times at the end of FY23, from 1.08 times the previous year.

Net Debt to EBITDA: The net debt to EBITDA ratio at the end of FY23 stands at 3.1 times, increased marginally, and was 3 times at the end of FY22.

Interest Service Coverage Ratio: During FY23, it improved by 15% to 5.20 times, from 4.54 times at the end of FY22.

Return on Capital Employed (ROCE): The company improved its ROCE in FY23 to 12% from 11% in FY22.

Net Profit Margin: At the end of FY23, net profit margin declined marginally by 3% to 26% from 29% at the end of FY22.

Adani Ports SEZ Share Price History

Mundra Port and SEZ launched its IPO on 1st November 2007, raising ₹1,771 crores from the market. The IPO price band was ₹400 to ₹440 per share. The IPO was a success, and it was oversubscribed 115 times. The stock was listed at a premium of 75%.

APSEZ

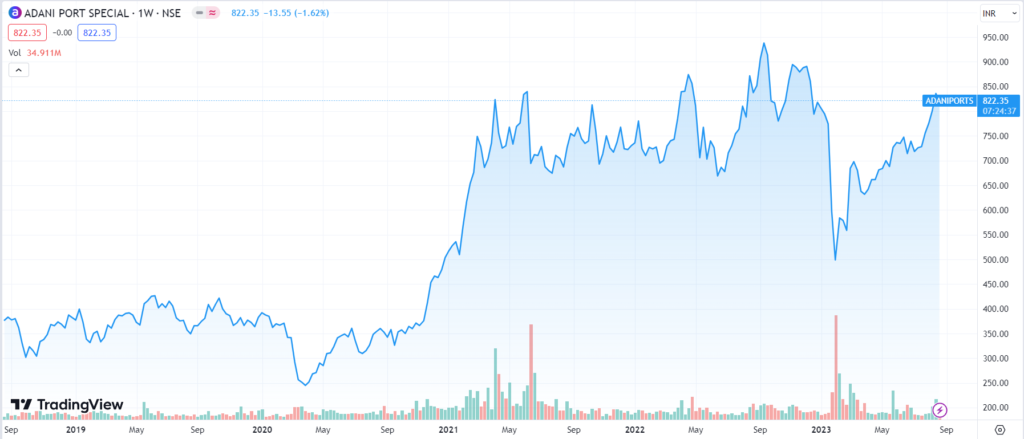
Adani Ports share price has given a CAGR return of 17% and 33% over the last 5 and 3 years, respectively, as of 24th August 2023. It underwent a split on 23rd September 2010 at a 10:2 ratio. The stock’s all-time high was ₹987.85 as of 19th September 2022.

Adani Ports consistently pays dividends to shareholders, having paid ₹5 in the last three years. As of 24 August 2023, Adani Ports SEZ has a market cap of ₹1,77,639 crores.

APSEZ Fundamental Analysis

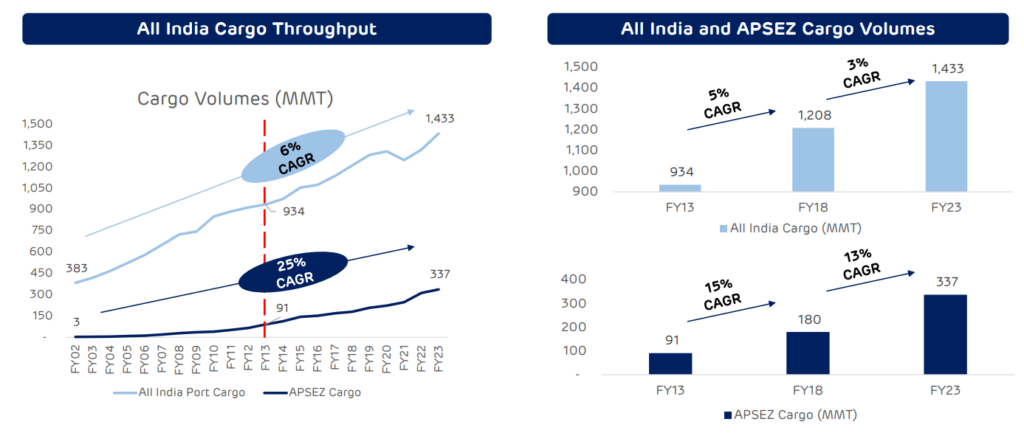
Adani Port SEZ is India’s largest transport utility company with strings of ports and an integrated logistics network. The company operates 14 ports along the country’s coastline, with a total installed capacity of 602 MMT. Compared to the national average of all India port cargo volume, which has grown at a 6% CAGR since 2002, APSEZ cargo volume has grown at a 25% CAGR over the same period.

AP1

In addition, over the last decade, the company has distributed its cargo volumes across ports and is no longer dominated by Mundra Port. From 91% of cargo volumes originating from Mundra port in FY13, the share has decreased to 46% in FY23.

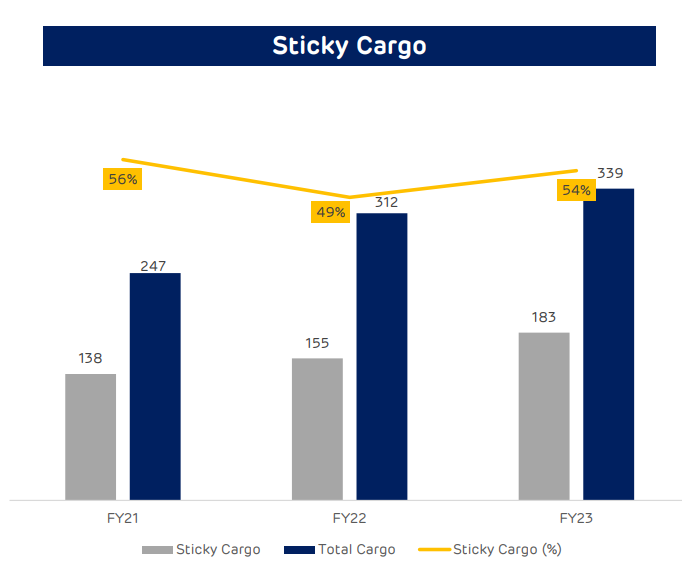
Furthermore, the share of sticky cargo of the overall cargo handled by different Adani Ports is around 50%. It was 54% in FY23. Sticky cargo is unlikely to be diverted to another port due to infrastructure constraints or a lack of facilities to handle specialized cargo such as crude oil, chemicals, and shipments from joint venture partners.

AP2

Since the Mundra Port commenced commercial operations, Adani Ports has established an operational benchmark in the industry and driven the transformation of India’s port sector. The company has an average turnaround time (TAT) for cargo ships of ~0.7 days, compared to the national average of 2 days. It was 5 days in 2011.

Adan Port’s strong organic growth of its ports business, combined with strategic inorganic acquisitions and the integration of logistics operations, has helped the company build a strong moat around the business over the years.

Adani Ports SEZ Future Growth Outlook

Adani Ports SEZ has embarked on a journey to become India’s largest transport utility company by 2030, strengthening its logistics segment from ports, warehousing, in-land transportation, last-mile delivery, etc.

The company has strategically targeted increasing its warehousing capacity by 38 times to 60 MN Sq. Ft. (15% of market capacity), have 15 MMLP covering all key markets, more than 2.5 MMT of grain silos, increase the rail network by 3 times to over 2,000 KM, and deploy 200+ trains (rakes) by FY26.

Furthermore, establishing the Dedicated Freight Corridor (DFC) connectivity to Mundra Port will provide faster port evacuation and quicker transit time. Due to the higher rail coefficient, customers preferred to export or import through Adani Ports. APSEZ’s cargo volume through rail grew by 22% in FY23 to 120.5 MMT from 98.6 MMT in FY22. And the overall rail coefficient improved to 39%.

Regarding efficiency, APSEZ ports had a capacity utilization rate of 60% in FY23, which increased from 45% in FY10. While the national average of other ports dropped from 91% in FY10 to 48% in FY23.

In FY24, Adani Ports plans to undertake a capex of ₹4000-4500 crores and reduce the Net Debt to EBITDA level from 3.1 to 2.5 times. The company also aims to deleverage its balance sheet and keep Net Debt to EBITDA level below 2.5 times over the long term.

Industry Outlook

In the fiscal year 2023, India achieved its highest-ever annual merchandise exports, reaching $447 billion, while merchandise imports climbed to $714 billion.

And, with the government’s unwavering commitment to establishing India as a global manufacturing hub, propelled by a series of policy initiatives such as the PLI Scheme, PM-GatiShakti, National Logistics Policy, and Sagarmala Pariyojana, there’s a strong expectation that India’s exports will skyrocket soon. In addition, Prime Minister Narendra Modi has set an ambitious export target of $2 trillion by 2030.

Concerning the logistics domain, India’s logistics costs as a percentage of its GDP stood at 13-14%, in stark contrast to the 8% seen in developed nations. This differential diminishes the competitiveness of Indian products on the global stage.

Ranked 38th in the Logistics Performance Index 2023, India aims to climb above 25 by 2030, underscoring its resolute commitment to enhancing logistical efficiency and promoting a more globally competitive business environment.

Adani Ports SEZ’s present business model and future plans are well-aligned to benefit from the rise of India’s global stature and trade. The company has strong fundamentals, and the long-term business outlook seems optimistic.

*Disclaimer Note: The securities quoted, if any, are for illustration only and are not recommendatory. This article is for education purposes only and shall not be considered as recommendation or investment advice by Research & Ranking. We will not be liable for any losses that may occur. Investment in securities market are subject to market risks. Read all the related documents carefully before investing. Registration granted by SEBI, membership of BASL, and certification from NISM in no way guarantee the performance of the intermediary or provide any assurance of returns to investors.

FAQs

When was Adani Ports SEZ incorporated?

Adani Ports SEZ was incorporated in 1998 as Gujarat Adani Port Limited. It started phased-wise operations at Mundra Port in October 1998, with commercial operations beginning in October 2001.

When were Adani Port SEZ shares listed on the stock exchange?

Mundra Port and SEZ launched their IPO on 1st November 2007 and listed the shares on the stock exchanges on 27th November 2007. As of 24 August 2023, the stock has given a CAGR return of 17% and 33% over the last 5 and 3 years, respectively.
Which ports are owned by Adani Ports SEZ?

Adani Ports SEZ owns Mundra Port, India’s largest port. The company also owns 13 other ports along the country’s coastline and two ports outside India in Colombo, Sri Lanka, and Haifa, Israel.

Read more:  How Long-term investing helps create life-changing wealth – TOI

Summary The rise of Polycab India is inspiring by all means and shows the aspirational spirit of the Indians and […]

Summary

The rise of Polycab India is inspiring by all means and shows the aspirational spirit of the Indians and their eagerness to achieve greater heights. In less than 40 years, the company has grown from a small-scale enterprise to a large-cap company, becoming India’s largest fast-moving consumer electrical company, manufacturing electrical cables, wires, and other electrical products. Not only that, but it exports its products to over 72 countries.

Let us understand the fundamentals of Polycab India.

History of Polycab India

Polycab India had a humble beginning in 1964 when Late Thakurdas Jaisinghani established Sind Electric Stores, which sold various electrical products such as fans, lighting, switches, and wires. Following his death in 1968, his four sons- Girdhari T. Jaisinghani, Inder T. Jaisinghani, Ajay T. Jaisinghani, and Ramesh T. Jaisinghani- took over the business.

The family founded a partnership firm “Thakur Industries”, which entered into a lease agreement with MICD in 1975 to lease a parcel of land in Andheri, Mumbai, to establish a factory to manufacture wires and cables, which remained operational until 1984.

Before closing the Mumbai unit, the four brothers formed a new partnership firm called “Polycab Industries” in 1983. They registered it as a small-scale industrial unit with the Directorate of Industries, Government of Gujarat, for a factory in Halol, Gujarat. They started manufacturing PVC insulated wires and cables, copper, aluminum, and bare copper wires.

In 1998, the company became a private limited company, and in 2018, it became a public limited company; Polycab Industries was renamed Polycab India Limited.

In FY23, it had a revenue of ₹14,108 crores, which has grown at a CAGR of 15% in the last four years.

Business Overview of Polycab India

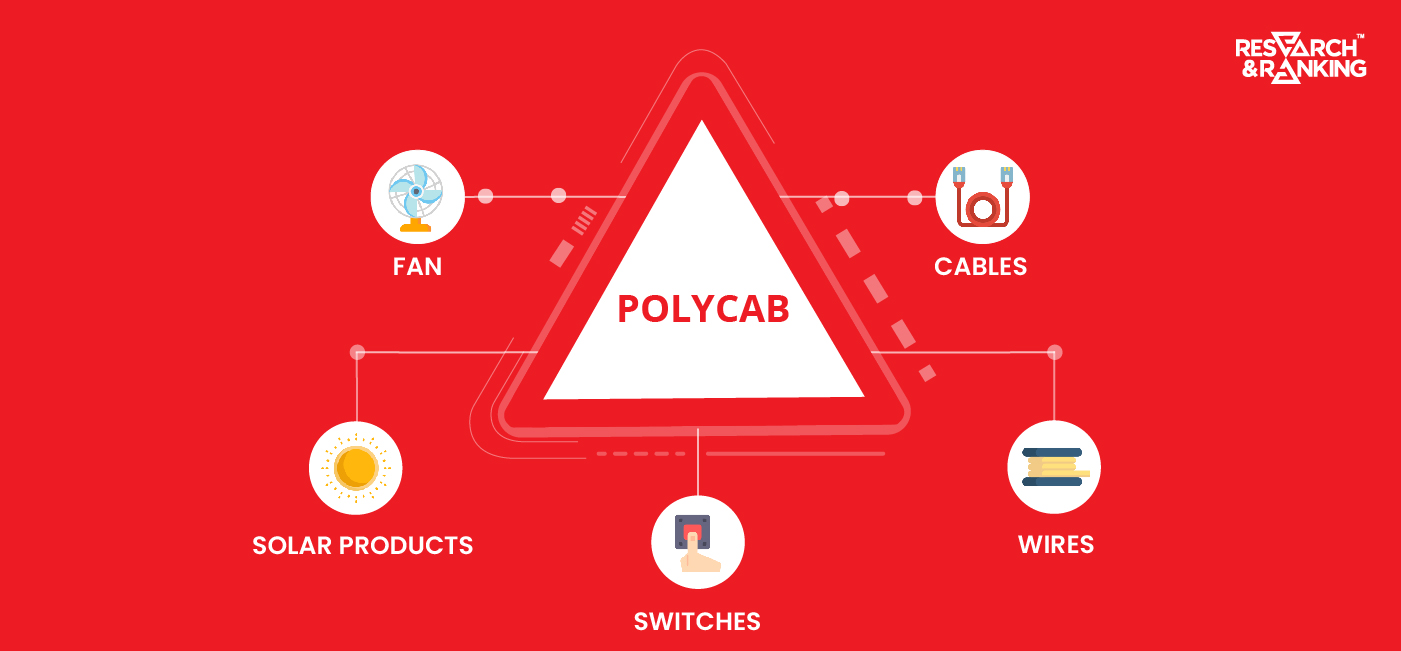
Polycab India is an undisputed market leader in the Indian wire & cables industry, commanding a 22-24% market share in the organized market. The company’s wires & cables business contributes 89% of its total product mix, and the remaining consists of FMEG products and others.

image 104
Source: Q1FY24-Earnings-Presentation.pdf
image 103
Source: Q1FY24-Earnings-Presentation.pdf

Polycab India has a retail presence in over 125,000 stores across India. It has divided its business into two operating segments:

  • Wires & Cables: It manufactures and sells various wires and cables for retail and industrial use.
  • FMEG: The FMEG business commenced operation in FY14, including a mix of consumer electrical products.

Key Management Personnel

Mr. Inder T. Jaisinghani is the company’s Chairman, Managing Director, and founding member. He was appointed to the position in 1997, and under his direction, the company has grown to be a leader in the wires and cables segment, with over 25 glorious years of success.

Mr. Bharat A. Jaisinghani is the Executive Director and joined the company in 2012. He holds a Master’s Degree in Operations Management from the University of Manchester and has worked in different verticals in the company. Mr. Bharat currently leads the growth initiatives of the company.

Mr. Nikhil R. Jaisinghani is the Executive Director and joined the company in 2012. He holds an MBA from Kellogg School of Management, USA. And currently leads the wires & special cable business.

Mr. Rakesh Talati is the Executive Director and has been with the company since 2014. He heads the wires & cables segment and is responsible for Greenfield and Brownfield in the country.

Mr. Gandharv Tongia is the Executive Director and Chief Financial Officer and has been associated with the company since 2018. He is a qualified chartered accountant related to Big 4 Audit firms, namely EY and Deloitte.

Polycab India Shareholding Pattern

image 101
As of 30-6-2023

Financials

Revenue

In FY23, the company reported a 16% year-on-year increase in total income to ₹14,107.8 crores from ₹12,203.8 crores in FY22. And, as per financial results in Q1FY24, total income increased 42% year-on-year to ₹3,953.3 crores from ₹2,780.9 crores in Q1FY23.

image 105
Source: Polycab_IAR%202023.pdf

Segment-wise Revenue Breakup

SegmentFY22 (in ₹ cr)FY23 (in ₹ cr)Q1FY23 (in ₹ cr)Q1FY24 (in ₹ cr)
Wires & Cables10,695.312,536.82,405.63,533.7
FMEG1,254.31,251.1308.1314.5
Other294.2358.499.8152.8
Source: Financial-Results-FY-2024-Q1.pdf
By GeographyFY22  (in ₹ cr)FY23 (in ₹ cr)
Within India11,32112,762.9
Outside India922.91,383.5
Source: Financial-Results-FY-2024-Q1.pdf

EBITDA

In FY23, the company reported a 45% year-on-year increase in EBITDA to ₹1,842.9 crores from ₹1,262.6 crores. And, in Q1FY24, EBITDA increased by 77% y-o-y to ₹548.6 crores from ₹309.8 crores.

image 106
Source: Q1FY24-Earnings-Presentation.pdf


 FY19FY20FY21FY22FY23Q1FY24
EBITDA/Net Sales Margin (in %)11.912.812.610.313.114.1
Souce: Polycab_IAR%202023.pdf

Net Profit

In FY23, Polycab India reported a 40% annual increase in net profit to ₹1,282.3 crores from ₹917.3 crores in FY22. And, in Q1FY24, net profits increased by 88% y-o-y to ₹402.8 crores from ₹222.5 crores in Q1FY23.

image 107
 FY19FY20FY21FY22FY23Q1FY24
Net Profit Margin (in %)6.38.710.17.59.110.4
Source: Polycab_IAR%202023.pdf

Key Financial Ratios

Current Ratio: At the end of FY23, the current ratio declined by 30 bps to 2.6 times from 2.9 in FY22.

Debt-to-equity Ratio: The company has no significant borrowings on its books, and its debt-to-equity ratio remains unchanged at 0.01 times as of the end of FY23.

Return on Capital Employed (ROCE): The company improved its ROCE in FY23 to 26.1%, from 20.4% in FY22.

Inventory Days: At the end of FY23, the inventory days, meaning the average number of days the company takes to sell its inventory, stand at 102 days.

Receivable Days: At the end of FY23, the receivable days, meaning the average number of days a customer takes to pay back a business for products purchased, stand at 32 days. It was 61 days in FY19.

Earning Per Share (EPS): In the last five years, EPS more than doubled to ₹84.9 in FY23 from ₹35.4 in FY19.

Polycab India Share Price History

Polycab India launched its initial public offering (IPO) in April 2019, raising ₹1,345 crores at a price range of ₹533 to ₹538. The IPO was a success, with 51.77 times oversubscription, and listed at a 20% premium above its issue price.

image 100

Polycab share price has given a CAGR return of 76% in the last three years as of August 21, 2023, and the stock price has doubled in the previous year. The share was listed at ₹633 on April 16, 2019, and is currently trading at ₹4,850. It made an all-time high of ₹4,924 on July 20, 2023.

The company has a consistent track record of paying dividends to its shareholders. It paid ₹10 in 2021, ₹14 in 2022, and ₹20 in 2023 as dividends.

As of August 21, 2023, Polycab India has a market cap of ₹72,797 crores.

Polycab Fundamental Analysis

Polycab is the undisputed market leader in the electrical wires and cable segment, with a 22-24% market share in the organized market. And its FMEG business has been growing at a CAGR of 30% since its inception. Over the years, Polycab has evolved as a company, improving its efficiency, expanding its product line, and global presence.

In the last three financial years, the company’s EBITDA margin stayed within a range of 10-13%, with signs of improvement in the current fiscal. In the last five years, the company has halved its receivable days to 32 days and its payable days to 52 days, which has helped the company to optimize its working capital requirement and reduce its financing costs.

Wires & Cables

The wires and cables segment accounts for nearly 90% of total revenue, which increased 17% yearly to 12,536 crores in FY23. EBIT increased by 58 percent during the period, and the EBIT margin was 13.1%.

The merger of Heavy Duty Cables (HDC) and Light Duty Cables (LDC) under Project LEAP played a vital key role in the outperformance of the segment in FY23. It helped in incremental cross-selling revenue and enhanced efficiencies across sales, supply chain, and operations.

In the last fiscal, the company’s institutional business showcased accelerated growth. Polycab is also supplying cables to Indian Navy warships like INS Vikrant.

FMEG

Since its inception in FY14, the FMEG business has grown rapidly, with sales reaching  ₹1,251.2 crores in FY23, with the western region, the company’s stronghold, demonstrating positive growth. The company’s FMEG growth story is led by factors like demand for premium products on the back of rising disposable income and the recent revival of the real estate sector.

However, despite rapid growth, the FMEG business does not significantly contribute to the bottom line. In FY23 and Q1FY24, the EBIT margin was negative at -0.5% and -2.3%, respectively.

International Business

The company’s international business reached a new milestone in FY23, contributing nearly 10% of revenue, up from 7.6% in FY22, with solid demand from the United States, Europe, and key industries such as oil and gas, renewables, and infrastructure.

Project Leap

Amidst all the visible megatrends in the Indian economy, Polycab has introduced Project Leap. It is a multi-year transformational journey divided into multiple phases. Polycab 1.0 was about the successful launch of the IPO. Polycab 2.0 was about improving the efficiency metrics of the business and transforming it into a distribution-led business.

The 3.0 stage is a five-year plan (FY2126) in which the company aims to:

  • Increase its revenue to ₹20,000 crores by FY26
  • 1.5X market growth in core segments
  • 2X market growth in emerging segments
  • 2X market growth in the FMEG segment
  • Achieve 10-12% EBITDA margin in the FMEG segment
  • A target of ~10% of the contribution from exports

In FY24, the company is also undertaking a capex of ₹600-700 crores, of which three-fourths will go towards the wires & cables business, and the remaining to go towards the FMEG segment. The future may be positive, yet factors like raw material price volatility, weak FMEG business growth, intense competition, and high inventory are vital concerns.

*Disclaimer Note: The securities quoted, if any, are for illustration only and are not recommendatory. This article is for education purposes only and shall not be considered as recommendation or investment advice by Research & Ranking. We will not be liable for any losses that may occur. Investment in securities market are subject to market risks. Read all the related documents carefully before investing. Registration granted by SEBI, membership of BASL, and certification from NISM in no way guarantee the performance of the intermediary or provide any assurance of returns to investors.

FAQs

When was Polycab India incorporated?

Polycab India was incorporated as a partnership firm in 1984 as Polycab Industries. It was initially engaged in the manufacturing and selling of PVC insulated wires and cables, copper, aluminum, and bare copper wires.

When was Polycab shares listed on the stock exchange?

Polycab India share was listed on April 16, 2019, and as of August 21, 2023, Polycab share price has given a CAGR return of 76% in the last three years.

Is Polycab a large or mid-cap company?

Polycab India is a large-cap company. As of August 21, 2023, its market share is ₹72,797 crores.

Read more:  How Long-term investing helps create life-changing wealth – TOI.

Summary IndusInd Bank started under the leadership of Mr. S.P. Hinduja to serve the NRI community. Today, IndusInd is the […]

Summary

IndusInd Bank started under the leadership of Mr. S.P. Hinduja to serve the NRI community. Today, IndusInd is the fifth largest private bank, creating substantial wealth for its shareholders over the long term. Let’s dig deeper into the company and see the potential of IndusInd Bank share price growth.

IndusInd Bank Overview

Induslnd Bank was incorporated 1994 as a commercial bank under the banking regulation Act of 1949. The then Finance Minister, Dr. Manmohan Singh, inaugurated the Bank in Mumbai, and the bank came out with its Initial Public Offering in November 1997. It is one of India’s leading financial services brands, serving approximately 35 million customers nationwide.

IndusInd provides banking solutions to individuals, large corporations, government entities, and PSUs. Its network includes 2606 branches/banking outlets and 2,875 ATMs across India, covering 1,38,000 villages. Additionally, the bank has representative offices in London, Dubai, and Abu Dhabi.

The Bank offers various products and services for individuals and corporates, including microfinance, personal loans, commercial vehicle loans, credit cards, and SME loans.

IndusInd Bank Journey

The following timeline illustrates the significant events and growth of the Bank since its establishment:

  • 1994-1995: IndusInd Bank was founded by Mr. Srichand P. Hinduja. The first branch opened in Mumbai with an initial investment of USD 35 million and was inaugurated by Dr. Manmohan Singh.
  • 1996-1997: The bank raised USD 30 million by issuing an Initial Public Offering in November 1997. It also successfully launched the concept of anywhere banking by expanding its network to 18 branches and 11 ATMs.
  • 1997-2000: The bank expanded its range of services to include FAST Forex, Indus Home, Indus Estate, and Indus Auto, among others.
  • 2001-2003: The bank introduced mobile banking and a suite of loan products, including housing, personal, and auto loans, to customers nationwide.
  • 2003-2004: The bank merged with Ashok Leyland Finance Limited.
  • 2004-2005: Bank partnered with Ashok Leyland for channel financing with a focus on expanding client relationships, and the bank opened its 100th branch in Dadar, Mumbai
  • 2005-2006: Bank raised INR 170 crores through the issuance of Tier-II bonds and entered into an agreement with NCDEX as their clearing banker.
  • 2008-2009: Bank launched new savings and current accounts to expand its consumer banking portfolio. It also created separate corporate, institutional, and commercial banking units to serve all corporate needs.
  • 2009-2010: The bank established a microfinance unit and introduced new products for corporate clients, expanding its offerings to include loan syndication, microfinance, and warehouse finance.
  • 2011-2012: Bank entered into a Memorandum of Understanding (MoU) with HDFC Bank for home loans.
  • 2013-2014: The Bank got added to the NIFTY 50 benchmark index.
  • 2015-2016: The bank acquired RBS’s Diamond & Jewelry Financing business in India and reached a milestone of 1,000 branches. Additionally, it achieved leadership in the Carbon Disclosure Project in the Indian corporate sector.
  • 2016-2017: The bank ranked 12th among the most valuable Indian brands in 2016 by Millward Brown and WPP. Bank introduced a specialized approach to cater to industries and created business units in Healthcare, Education, Logistics, Pharma, MNC, and Financial Services.
  • 2017-2018: The bank has announced a merger with Bharat Financial Inclusion Limited, one of the largest microfinance institutions in India.
  • 2018-2019: The IndusInd bank launched a new product line that includes the Duo card, a debit-cum-credit card.
  • 2022-2023: IndusInd Bank has partnered with MoEngage to offer its customers a unique digital experience. Additionally, the bank has announced a strategic partnership with the Asian Development Bank (ADB) to support and promote Supply Chain Finance solutions in India.

IndusInd Bank Management Profile

Mr. Sunil Mehta is the Chairman of the bank. He has 40 years of leadership experience in banking, finance, insurance, and investments with top global and domestic financial institutions, including Citibank, AIG, SBI, PNB, and YES Bank. He graduated from Shri Ram College of Commerce, Delhi University, and is a Fellow Member of the Institute of Chartered Accountants of India. He is also an alumnus of the Wharton School of Management at the University of Pennsylvania.

Mr. Sumant Kathpalia is the Managing Director and CEO of the bank. Before joining IndusInd Bank, Mr. Sumant gained years of valuable experience as a career banker at Citibank, Bank of America, and ABN AMRO. He joined IndusInd Bank as part of the management team 15 years ago and has been instrumental in turning the bank around. He holds a bachelor’s degree in B Com (Hons.) from Hindu College, Delhi University, and is also a qualified Chartered Accountant.

Mr. Gobind Jain is the Chief Financial Officer of the Bank. Mr. Jain worked as Joint President of Group Accounts and MIS at Kotak Mahindra Bank (KMB) for over 15 years. Mr. Jain has an impressive accounting and financial management background, having worked with esteemed institutions such as ICICI Bank, Bank of America, Reserve Bank of India, and Bank Internasional Indonesia. He is a qualified Chartered Accountant, Financial Analyst, Financial Risk Manager, and CPA Australia.

Mr. Zubin Mody is the Chief Human Resources Officer of the Bank. Currently, he leads the HR Function at IndusInd Bank; he joined the bank in December 2005. Before this, he was heading the HR function at ICICI Lombard. He graduated with honors in Physics from Mumbai University and holds a Management Degree in Personnel Management & Human Resources from XLRI, Jamshedpur (1993).

IndusInd Bank Shareholding Pattern

image 80
Source: BSE Website

IndusInd Bank Business Segments

The IndusInd bank has a diversified loan book across Consumer and Corporate Products. The consumer loan book is ~54% of the total as of Jun 2023 and comprises Vehicle Finance, Non-Vehicle Finance, and Microfinance segments.

The corporate loan book is 46% of the total and comprises large and mid-size corporates.  Within the corporate book, the focus is on granular, high-rated customers.

image 81
Source: IndusInd Investor Presentation Q1FY24
Consumer BankingJune-23% of the Loan Book
Vehicle Finance78,332 Cr26%
Non-Vehicle Finance51,567 Cr17%
Microfinance31,981 Cr11%
Total Advances1,61,880 Cr54%
Source: IndusInd Investor Presentation Q1FY24
Corporate BankingJune-23% of the Loan Bank
Large Corporates77,065 Cr25%
Mid Corporates47,624 Cr16%
Small Corporates14,748 Cr5%
Total Advances1,39,437 Cr46%
Source: IndusInd Investor Presentation Q1FY24

IndusInd Bank Financials

  • Core Operating Profit and Net Profit

The company has reported an Operating Income of INR 25,758.49 Cr during the Financial Year ended March 31, 2023, compared to INR 22,335.04 Cr during the Financial Year ended March 31, 2022.

The company has posted a net profit of INR 7389.72 Cr for the Financial Year ended March 31, 2023, as against a net profit of INR 4611.12 Cr for the Financial Year ended March 31, 2022.

In INR Cr.FY19FY20FY21FY22FY23
Interest Income22,261.1528,782.8328,999.8030,822.4436,367.92
Interest Expense13,414.9716,724.0915,471.9115,821.6018,775.80
Net Interest Income8,846.1812,058.7413,527.8915,000.8417,592.12
Non-Interest Income5,646.726,951.316,558.617,334.208,166.37
Revenue14,492.9019,010.0520,086.5022,335.0425,758.49
Profit After Tax3,301.104,417.912,836.394,611.127,389.72
Source: IndusInd Annual Reports (FY20 to FY23)
  • Net Interest Income & Net Interest Margin

Net Interest Income (NII) is the difference between the interest earned on a bank’s assets (such as loans and investments) and the interest paid on its liabilities (such as deposits and borrowings).

Net Interest Margin (NIM) is calculated by dividing the NII by the average interest-earning assets.

Net Interest Income for the quarter of June 30, 2023, at INR 4,867 Cr, grew by 18% YoY and 4% QoQ. Net Interest Margin for Q1 of FY24 stood at 4.29% against 4.21% for Q1 of FY23 and 4.28% for Q4 of FY23. The bank has been increasing its NIM% consistently by focusing on high-yielding segments like MFI and vehicle finance.

image 82
Source: IndusInd Annual Reports (FY20 to FY23) and Q1FY24 Investor Presentation
  • Asset Quality (GNPA & NNPA)

NPA stands for Non-Performing Asset. It refers to a loan or an advance where the borrower has not paid the interest or the principal amount for a specified period, usually for 90 days or more.

Gross NPA refers to the total value of a bank’s non-performing assets. Net NPA, on the other hand, is the value of NPA after reducing the provisions made by the bank to cover the losses that may arise from such non-performing assets.

IndusInd’s reported asset quality metrics for corporate and retail segments have been range bound, with overall GNPA between 1.0% – 1.2% from March 31, 2014, to December 31, 2018. Since fiscal 2019, due to slippage of some corporate accounts and COVID-19-related stress in the past fiscal, the gross NPA has increased steadily to 2.9% as of June 30, 2021, which has improved to 1.94% as of June 30, 2023. The GNPA of the Bank is one of the lowest in the industry, with adequate provision coverage of 71% and a provision buffer of INR 1700 Cr, with total loan-related provision standing at 2.4% as of June 2023.

image 83
Source: IndusInd Investor Presentations (Q3FY22 to Q1FY24)
  • Advances & Deposits

An advance refers to a loan or credit extended by a bank to its customers. Banks offer various advances such as personal, business, home, education, vehicle, and credit card loans. Advances as of June 30, 2023, were INR 3,01,317 Cr as against INR 2,47,960 Cr, an increase of 22% compared to June 30, 2022.

Deposits are a critical source of funding for banks, and they use these funds to provide loans and advances to customers.

Deposits as on June 30, 2023, were INR 3,47,047 Cr as against INR 3,02,719 Cr, an increase of 15% over June 30, 2022. Deposits growth is driven by granular retail deposits. The bank has a stable, low-cost deposit base, another reason contributing to the high profitability of the bank.

image 84
Source: IndusInd Annual Reports (FY20 to FY23) and Q1FY24 Investor Presentation

The bank’s share of CASA (Current Account & Savings Account) deposits ratio is ~40% as of Q1FY24 and has reduced slightly from 43% in Q1FY23. Bank continues to focus on this journey of growing better CASA deposits which will help reduce the overall cost of deposits and manage liquidity.

image 85
Source: IndusInd Q1FY24 Investor Presentation
  • Improving Return ratios (ROA & ROE)

IndusInd Bank has been improving its RoA (A higher RoA suggests that a bank is more efficient in generating profits from its assets) & ROE (the higher the ROE, the more efficient a company’s management is at generating income and growth from its equity financing) over the last few quarters as can be seen in the chart below.

IndusInd Bank’s ROA currently stands around 1.9%, supported by healthy net Interest margins with some exposure to high-yield segments such as vehicle finance and MFI.

image 86
Source: IndusInd Q1FY24 Investor Presentation

IndusInd Bank Share price history

IndusInd Bank launched its IPO in Jan 1998 at ~INR 45 per share, and today, the stock trades at INR 1372 per share (as of 18th August).

Like all private banks in India, IndusInd, too, has created significant wealth for its shareholders. The stock has delivered a 10-year CAGR of ~14% (from 18th August 2003 to 18th August 2023). More recently, the stock has given a 3-year CAGR of ~39% (from 18th August 2010 to 18th August 2023).

image 87
Source: TradingView

IndusInd Bank Share Price Target Growth Potential

The management has introduced planning cycle – 6 (FY23–26), wherein they have guided for 18-23% YoY credit growth, mainly driven by retail (55-60% proportion) and PPOP margins (pre-provision operating margins) to be 5.25-5.75% range.

The focus will be on new business verticals (home loans) to aid business growth and gain market share. An uptick in NIMs is expected, led by a higher share of retail loans, including the micro-finance segment.

The company is investing in ramping up phygital distribution channels, which will keep the Cost to Income ratio elevated for a couple of quarters. However, improvement in credit cost will boost earnings growth and return ratio.

Key Risks:

  • An unanticipated rise in defaults to erode margins and increase credit cost

Any unexpected rise in delinquencies, particularly in the vehicle and MFI segments, could increase the stress on assets and strain its profitability. Higher-than-anticipated failure could result in elevated interest income reversals, lower credit yield, and margin compression.

  • Lower credit growth in FY24 and FY25

Any further weakness in credit quality and lower credit demand could impact interest income and fee revenue recognition, thereby impacting profitability.

*Disclaimer Note: The securities quoted, if any, are for illustration only and are not recommendatory. This article is for education purposes only and shall not be considered as recommendation or investment advice by Research & Ranking. We will not be liable for any losses that may occur. Investment in securities market are subject to market risks. Read all the related documents carefully before investing. Registration granted by SEBI, membership of BASL, and certification from NISM in no way guarantee the performance of the intermediary or provide any assurance of returns to investors.

FAQs

Who is the promoter of IndusInd Bank?

IndusInd International Holdings Ltd, an entity belonging to promoters Hinduja Group, has a 12.57% stake in the lender. IndusInd Ltd has a 3.93% stake per the company’s latest shareholding pattern available with the Indian stock exchange BSE.

What is the 52 Week High and Low of IndusInd Bank?

52 Week high of IndusInd Bank is INR 1446 per share, and 52 Week low of IndusInd Bank is INR 990 per share.

What is the face value of IndusInd bank share?

The face value of IndusInd Bank share price is INR 10 per share.

Read more:  How Long-term investing helps create life-changing wealth – TOI

Introduction Sona BLW is a prominent Indian company with a global presence that manufactures differential gears, motors, and other components. […]

Introduction

Sona BLW is a prominent Indian company with a global presence that manufactures differential gears, motors, and other components. It holds a 60-90% market share in various segments of the Indian differential gears (DG) market.

The company plans to expand manufacturing capacity and launch new products. Let’s understand more about the company.

Sona BLW Overview

Sona BLW is a global manufacturer of automotive systems and components with origins in India. The company has nine manufacturing and assembly plants across India, China, Mexico, and the USA, of which six are in India.

The company is India’s leading auto ancillary company, specializing in designing, manufacturing, and supplying highly engineered, mission-critical automotive systems and components. These include differential assemblies, differential gears, conventional and micro-hybrid starter motors, BSG systems, EV traction motors, and motor control units.

It supplies these products to automotive OEMs across the US, Europe, India, and China for use in all categories of vehicles, including conventional passenger vehicles, commercial vehicles, off-highway vehicles, electric cars, electric light commercial vehicles, and electric two-and-three-wheelers.

The company develops mechanical and electrical systems, software solutions, and components to meet customer demands. The company has nine manufacturing plants, 3 R&D Centers, and 4064+ employees.

Sona BLW Journey

 Here are some of the critical milestones in the company:

  • 1995: The company was incorporated as Sona Okegawa Precision Forgings Ltd. in a joint venture with Mitsubishi Metal Corporation Limited.
  • 1998: The Company started manufacturing differential bevel gears at its first plant in Gurugram, Haryana, India.
  • 1999: The company established a manufacturing facility in Chennai, Tamil Nadu, India.
  • 2005: A new manufacturing plant was launched in Pune, Maharashtra, India, by the company. Additionally, Sona Autocomp Holding Private Limited became the company’s majority shareholder.
  • 2008: Acquired Thyssen Krupp’s precision forging business (which had previously acquired the company BLW, the inventor of Warm Forging Technology).
  • 2013: The company was renamed “Sona BLW Precision Forgings Limited.” It was also awarded the “North American OEM of PV’s and CV’s World Excellence Award (Silver).”
  • 2016: The Company was recognized with a Gold World Excellence Award for being a leading North American OEM of PV’s and CV’s.  It also established a new manufacturing plant in China and received an investment from JM Financial Trustee. Contract with Mitsubishi and Metal One has been terminated
  • 2017: Two new plants commenced operations in Gurugram, India, and the Company also launched the final assembly and finishing plant in Mexico, North America.
  • 2018: Acquired new land for a second plant in Chakan, Pune. It was awarded the contract for Differential Assembly supply by a renowned Global Electric Vehicle Manufacture
  • 2019: The brand name “Sona Comstar” was adopted by the Company, and the differential assembly plant commenced operations in Manesar, Haryana, India.
  • 2020: Achieved a production milestone of 250 million Gears and awarded contracts for BLDC (Brush Less Direct Current) motor supply by two Indian Electric 2 Wheeler Manufacturers
  • 2021: The Company got listed on the Indian Stock Exchanges

Sona BLW Management Profile

  • Mr. Vivek Vikram Singh is the company’s Managing Director and group CEO. He holds a bachelor’s degree in technology in computer science and engineering from HBTI Kanpur and a postgraduate diploma in management from IIM Ahmedabad. He has over 18 years of experience, including eight years of experience in the automotive industry. He is responsible for capital allocation, strategic decisions for growth, business development, managing financial stakeholders, and performance monitoring of individual business units of the company.
  • Mr. Rohit Nanda is the Group Chief Financial officer of the company. He is a qualified chartered accountant with over 20 years of experience in diverse industries, including automotive, steel, engineering, pharma, chemical, and industrial goods. He is responsible for capital allocation, financial reporting, investment decisions, risk management, and information technology.  
  • Mr. Kiran Manohar Deshmukh is the Chief Technology officer of the company. He holds a bachelor’s degree in technology in metallurgical engineering from IIT Bombay. He has significant experience in automotive components manufacturing and has worked in the areas of, among others, manufacturing, process control, and design. He is responsible for steering the development of new technologies, establishing technology partnerships, and building competencies in manufacturing excellence in the company. He joined the company on July 1, 2019.

Sona BLW Shareholding Pattern

image 71
Source: BSE India

Sona BLW Business Segments

The product line of the company can be classified under two segments:

  1. Driveline parts – differential assembly and gears
  2. Motors

Driveline parts segment: The Company produces differential assemblies and precision-forged bevel gears for electric and non-electric vehicles, including passenger cars, commercial vehicles, off-highway vehicles, and three-wheelers.

Motors segment: The company produces starter motors for conventional, micro-hybrid, and EVs. It also manufactures motor control units and EV traction motors for hybrid and electric vehicles, including two and three-wheelers.

Sona BLW Fundamental Analysis

Sona BLW caters to all major automotive segments, including Passenger Vehicles, Commercial Vehicles, Tractors, and Off-Highways. Sona BLW is the largest manufacturer of differential gears for PVs, CVs, and tractors in India. They are also ranked among the top 10 global suppliers of differential bevel gears and starter motors for PVs. 

In CY22, Sona BLW has a 7.2% market share in global differential gears and 4.1% in starter motors globally. In the domestic market, the company holds 80-90% market share in commercial vehicles, 75-85% in tractors, and 55-60% in passenger vehicles.

The company operates in various vehicle segments, including PVs, CVs, OHVs, and E2W/E3W, with a revenue mix of 69%, 15%, 12%, and 4%, respectively. However, it has a high dependency on the passenger vehicle segment.

The company has a solid clientele base. Almost all well-known automotive manufacturers are customers of SONA BLW, like Maruti Suzuki, Renault, Nissan, Volvo, etc. In FY 2022-23, the top 5 customers contributed 55% of the revenue, while the top 10 contributed 77% to the total revenue for the company.

The Company generated 29% of its revenues from India. The remaining revenue came from overseas operations in North America (43%), Europe (20%), and Asia/Others (8%).

image 72
Source: Sona BLW Annual Report FY23

The company continues to focus on R&D to develop new innovative systems and components. In FY 2023, the company invested INR 73.1 Cr rupees in R&D with 273 on-roll employees across three centers in India located in Gurugram and Chennai.

The company has increased its focus on the electric vehicle segment, and its revenue contribution is 26%. The company operates 46 EV programs across 27 customers, and BEV (Battery Electric Vehicles) revenue contributes 26% share in FY 2022-23.

The company plans to focus on light passenger, commercial vehicles, and electric buses over the next three years. It aims to expand in Europe for differential assemblies and gears and in China for micro-hybrid starter motors and 48V BSG systems.

In FY 2023, the Company announced its entry into the sensors and software market by acquiring a 54% stake in Novelic.

Revenue & Profitability

Sona BLW posted revenue of INR 2,676 Cr during FY23 compared to INR 2,131 Cr during FY22, an increase of 25.57%.

On the profitability front, the company has posted a PAT of INR 395.3 Cr for FY23 as against the PAT of INR 361.5 Cr for FY22, an increase of 8.5%.

If we look at the financial performance over the Financial Year 2019 – 2023, the company has posted a Revenue CAGR of 39.86% and a PAT CAGR of 23.16%, which is relatively good.

Sona BLW has consistently delivered operating margins (EBITDA %) in the range of 26% to 28% since 2018, which is relatively high for an auto ancillary manufacturer. The company has done reasonably well on execution and delivered well on Revenue growth, profitability growth, and margins.

image 73
Source: Sona BLW annual Report FY23

Return on Equity & Return on Capital Employed

Sona BLW has consistently delivered ROCE and ROE of over 25% over the last five years. This can be credited to the existing manufacturing facilities’ high operating margins and asset turnover.

The company can generate high ROCE on the back of innovative products being launched to cater to the requirements of auto manufacturers globally.

image 74
Source: Sona BLW Q1FY24 Investor presentation

Sona BLW Share Price History

Sona BLW was listed on NSE & BSE in June 2021 at a price per share of INR 302.4 and currently trades at INR 555.6 per share (as of 13 August 2023). During this period, the company achieved an all-time high price of INR 835 per share on 14th Dec 2021.

image 75
Source: Tradingview

Key risks:

Undertrial products may not get acceptance – It is also possible that the hybrid technology that uses a 48V BSG motor may not find acceptance globally, or BV penetration increases much faster. In that case, SONA will have to develop alternative products.

Volatility in critical raw materials – The Company’s business could be affected by commodity price volatility, which could affect the firm’s overall cost of manufacturing operations. Though it has adequate mechanisms to monitor and manage various market risks, the effects of changes in commodity prices cannot always be predicted, hedged, or offset with price increases to eliminate the impact on the Company’s overall profitability.

Change in regulations and industry trends -The automotive industry is subject to environmental and other laws. Therefore, any adverse impact on the industry and the Company’s customers due to any change in such rules can affect its business. Further, there has been a gradual shift in the industry from pure ICE-dependent vehicles. An acceleration in this trend will adversely affect the ICE-dependent business of the Company.

Overdependency on top five customers- The top 10 customers contributed 77% of the revenue. If top existing clients cancel the order, it may affect the finances.

*Disclaimer Note: The securities quoted, if any, are for illustration only and are not recommendatory. This article is for education purposes only and shall not be considered as recommendation or investment advice by Research & Ranking. We will not be liable for any losses that may occur. Investment in securities market are subject to market risks. Read all the related documents carefully before investing. Registration granted by SEBI, membership of BASL, and certification from NISM in no way guarantee the performance of the intermediary or provide any assurance of returns to investors.

FAQs

What is the face value of Sona BLW?

The face value of Sona BLW is INR 10 per share.

What is the Market cap of Sona BLW?

The market cap of Sona BLW is INR 32,742 crores as of 8th Aug 2023.

Read more:  How Long-term investing helps create life-changing wealth – TOI

Introduction Since independence, Tata Steel and SAIL (The Steel Authority of India Limited) have played a key role in the […]

Introduction

Since independence, Tata Steel and SAIL (The Steel Authority of India Limited) have played a key role in the country’s industrial growth. Being the oldest and foremost steel manufacturers in India, both companies have been instrumental in supplying essential raw materials for infrastructure development, manufacturing, and various sectors of the economy.

However, this article focuses on understanding the fundamentals, analyzing SAIL share price, and exploring its future growth potential. Let’s dig deeper into the company and understand if SAIL can achieve a market capitalization of ₹1 lakh crore in the next five years.

SAIL Company History

SAIL is one of the Maharatna category Central Public Sector Enterprises (CPSE) and one of the leading steel manufacturers in the country. The Maharatna status is awarded to a company that has achieved a net profit exceeding ₹5,000 crore consistently for three consecutive years, maintains an average annual turnover of ₹25,000 crore over three years, or maintains an average annual net worth of ₹15,000 crore over three years.

But, you might be too surprised to learn that SAIL, initially, wasn’t formed as an operating company but as a holding company with the primary purpose of overseeing the input and output of government-owned steel plants in the country.

  • 1950: The origins of SAIL can be traced back to the establishment of Hindustan Steel Limited (HSL) in the early 1950s. HSL’s original focus was to manage the forthcoming Rourkela Steel Plant operations.
  • 1954: Hindustan Steel Limited (HSL) is formed. It comprised of four plants: Bhilai Steel Plant, Rourkela Steel Plant
    Durgapur Steel Plant, and Alloy Steel Plant
  • 1957:Subsequently, in 1957, the Iron and Steel Ministry transferred the supervision and control of the Bhilai and Durgapur Steel Plants to HSL.
  • 1960: Rail & Structural mill commissioned at Bhilai Steel Plant
  • 1962: January 1962 saw HSL manage a total steel production capacity of 2 MT. The Wheel & Axle plant was inaugurated at Durgapur
  • 1968: Construction of Bokaro Steel Limited starts and other facilities commissioned at various HSL plants.
  • 1972: On December 2, 1972, the Ministry of Steel and Mines presented a policy document to the parliament to create a new industry management model.
  • 1972: First blast furnace at Bokaro Steel Plant inaugurated, Salem Steel Limited formed in Tamil Nadu and RDCIS established in Ranchi.
  • 1973: SAIL was officially incorporated on January 24, 1973, with an authorized capital of Rs 2000 crore. SAIL’s role was to manage the operations of five integrated plants in Rourkela, Bhilai, Durgapur, Bokaro, and Burnpur. The Bokaro steel plant helped increase the overall crude steel production capacity to 4 MT by 1973.
  • 1978: SAIL underwent significant restructuring, transforming into an operating company. The Indian Iron & Steel Company (IISCO) taken over as subsidiary.
  • 1985: Inauguration of integrated trial run of Meghahataburu iron ore project
  • 1986: First modernization phase initiated at Durgapur and SAIL takes over Maharashtra Electrosmelt Limited (MEL), subsequently renamed Chandrapur Ferro Alloy Plant (CFP).
  • 1989: The Raw Material Division was formed and the subsidiary Visvesvaraya Iron & Steel Plant (VISL) merged into SAIL.
  • 1992: SAIL gets listed in Bombay Stock Exchange
  • 1995: Rourkela Steel Plant’s first modernisation commissioned
  • 1997: SAIL becomes a Navratna company
  • 2001: SAIL enterst into JV with NTPC to form NSPCL for captive power generation
  • 2004: SAIL environment policy was released and the Bhilai plant produces first 80 meter long rail
  • 2006: IISCO merged with SAIL
  • 2007: Modernisation and expansion plan initiated to increase crude steel production to 21.40 MTPA
  • 2010: SAIL becomes a Maharatna company
  • 2013: Durga, India’s second largest blast furnace (Capacity: 4060 m3) comes up at RSP. Special grade steel from Bhilai and Rourkela used for building India’s first indigenouse aircraft carrier, INS Vikrant.
  • 2015: Steel plants at Rourkela and IISCO modernised and dedicated to the Nation
  • 2017: Rail Mill at BSP produced world’s longest single piece rail measuring 130 mtr
  • 2018: LHB wheels developed and supplied by DSP. Steel Authority of India launched its new ‘NEX’ brand Parallel Flange Section.
  • 2019: Steel Authority of India launched its new branded TMT bars SAIL SeQR.

Business Overview of SAIL

Steel Authority of India’s operating crude steel capacity is around 19.5 Metric Tons (MT), and it has a product mix of flats, longs, and semis.

Flats steel products include plates, hot-rolled & cold-rolled sheets, and coated sheets. Long products consist of rails, bars, and rods. And semis are semi-finished steel products that are further rolled or forged to produce finished steel products.

image 57
Source: Performance Highlights FY23

Steel produced by SAIL is primarily consumed in the country and contributes only a tiny portion of export revenue. In FY23, only 3% of the total produce was exported.

Operating Segments

The company has considered its five integrated and three alloy steel plants’ reportable operating segments.

  • Bhilai Steel Plant (BSP)
  • Bokaro Steel Plant (BSL)
  • Durgapur Steel Plant (DSP)
  • Rourkela Steel Plant (RSP)
  • IISCO Steel Plant (ISP)
  • Tamil Nadu and Alloy Steel Plant (ASP)
  • Salem Steel Plant (SSP)
  • Visvesvaraya Iron & Steel Plant (VISL

SAIL Management Personnel

  • Shri Amarendu Prakash is the Chairman and Managing Director at SAIL and leads the company’s operations and initiatives. He took charge as Chairman on 31st May 2023, and previously he held the post of Director in charge at Bokaro Steel Plant. He joined SAIL in 1991 as a Management Trainee (Technical). He graduated from BIT Sindri as a metallurgical engineer.
  • Shri Anirban Dasgupta is the Director of the Bhilai Steel Plant and started his career in SAIL in 1986. He is a distinguished alumnus of IIT-BHU in Metallurgy.
  • Shri Atanu Bhowmick is the Director of the Rourkela Steel Plant and is a Metallurgist from NIT, Rourkela. He joined SAIL/ Rourkela Steel Plant in1988 in the blast furnace department and has worked in various capacities.
  • Shri Brjendra Pratap Singh is the Director of Burnpur and Durgapur Steel Plant. He is an ISM-Dhanbad alumnus and joined SAIL in 1989.
  • Shri Vijendla Srinivasa Chakravarthy is the Director (Commercial) of SAIL and joined the company’s Central Marketing Organization in 1987. He is a chemical engineer from the Laxminarayan Institute of Technology, Nagpur University.
  • Shri Anil Kumar Tulsiani is the Director (Finance) and is a seasoned finance professional. During his tenure, he joined SAIL in 1988 as Junior Manager (Finance) and worked in different plants and units at SAIL. Shri Tulsiani is a qualified CMA and MBA (Finance).

SAIL Shareholding Pattern

image 56
Source: Shareholding as of 30th June 2023

SAIL Financials

Revenue
SAIL’s revenue from operations in FY23 was ₹1,04,447 crores, which increased marginally by 0.94 % from ₹1,03,4 73 crores in FY22. In Q1FY24, total income rose marginally by 1% to ₹24,800 crores from ₹24,334 crores in Q1FY23.

image 52
Source: SAIL Performance Q1 Highlights p.24

Segment-wise Revenue From Operations

 FY22 (in ₹ cr.)FY23 (in ₹ cr.)
Bhilai Steel Plant27,993.2330,516.07
Durgapur Steel Plant11,853.2913,250.48  
Rourkela Steel Plant26,830.5725,600.33
Bokaro Steel Plant28,531.6326,343.77
IISCO Steel Plant12,200.7813,520.93
Alloy Steels Plant896.841,000.55
Salem Steel Plant2,685.351,881.81
Visvesvaraya Iron & Steel Plant377.11310.86
Others3,324.181,445.29
Source: Financial Results Q4 FY23

EBIDTA

In FY23, SAIL’s EBITDA came in at ₹ 9,379 crores, which declined by 58% from ₹ 22,364 in FY22. And, in Q1FY24, EBITDA declined by approximately 20% to ₹ 2090 crores from ₹ 2606 crores in Q1FY23.

image 58
Source: SAIL Performance Highlights FY23

Net Profit

In FY23, SAIL’s profit after tax declined by 84% to ₹ 1,903 crores from ₹ 12,015 crores in FY22. For Q1FY24, profit after tax declined by 80% to ₹ 150 crores from ₹ 776 crores in Q1FY23.

image 59
Source: SAIL Performance Highlights FY23

SAIL Key Financial Ratios

  • Current Ratio: At the end of FY23, the current ratio improved marginally to 0.77 times from 0.73 at the end of FY22.
  • Debt-to-equity Ratio: The debt-to-equity ratio increased to 0.59 times on 31st March 2023, from 0.33 times compared to the previous fiscal.
  • Interest Service Coverage Ratio: SAIL’s interest service coverage ratio declined to 2.0     5      times at the end of FY23 from 9.56 times in FY22. The decline was due to a significant reduction in profitability metrics over the last two fiscal years.
  • Inventory Turnover Days: In FY23, the inventory turnover increased significantly to 99 days from 77 days in FY22.
  • Operating Margin: The operating profit margin for the year ended 31st March 2023 dropped to 8.98% from 21.61% in FY22.
  • Net Profit Margin: The net profit margin declined to 1.82% in FY23 from 11.61% in FY22. 

SAIL Share Price History

SAIL was listed through the Government of India’s disinvestment process rather than an IPO. The company sold 1.18% of its stake to financial institutions in the first tranche of disinvestment in 1991-92. The second tranche happened in 1994 when the government offered the public up to 14.95 of the equity shares. In 2004, 10% of the equity was divested, followed by 5% in 2014. The latest disinvestment occurred in 2021 when the government successfully offloaded a 10% stake through an Offer for Sale (OFS) mechanism.

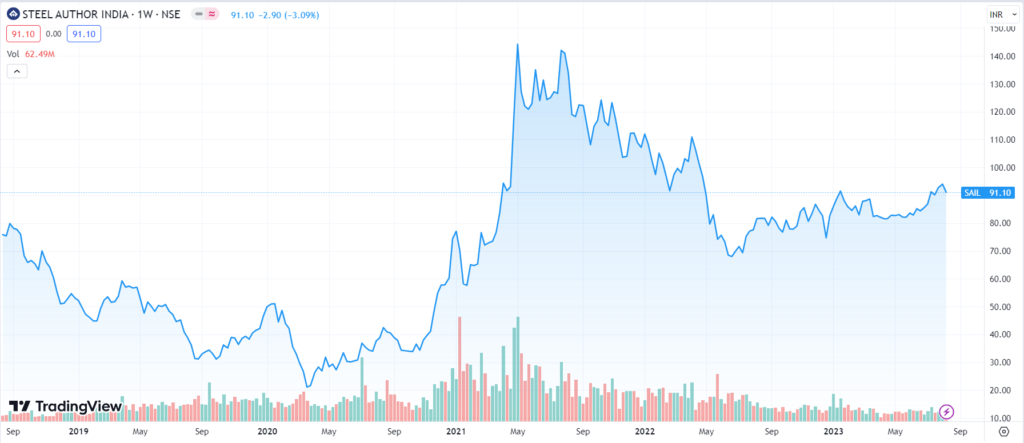
As on 12th August 2023, SAIL share price has given a CAGR return of 33% in the last three years and 12% returns in the last year.

sail
Source: TradingView

The stock has struggled to sustain upward momentum in the past five years. SAIL’s shares reached an all-time high of ₹151.30 on May 10, 2021. However, the stock has since experienced a decline, attributed to the impact of weak macroeconomic conditions and the cyclicality nature of the metal stocks.

The company has a good track record of paying rich dividends to its shareholders. It paid ₹6.8 in 2021, ₹4.75 in 2022, and ₹1 as interim dividend in 2023. As of 12th August 2023, SAIL has a market capitalization of ₹37,629 crores.

SAIL Fundamental Analysis

One factor that drives the stock price of most metal companies, including steel, is cyclicality. Meaning the price of metal stock swings as per the business cycle of an economy. These stocks tend to perform best when the economy is recovering or in a high-growth phase.

SAIL’s financial performance over the last two fiscal years is witnessing a downward pressure, mainly on account of a sharp fall in the global steel prices and reduced global demand. Post-pandemic, rise in global steel price, fall in fuel costs, and better-than-expected economic recovery helped steel companies to improve profitability. During the period, SAIL share price rose from around ₹20 level to ₹151.30 in less than 18 months

Global Price of Metal Index

Metal price
Source: International Monetary Fund

Factors that Impacted Profitability

  • The company’s sales have remained subdued in the last two fiscal years, with only 16.15 MT sold in FY22 and 16.20 MT sold in FY23.
  • Increase in the cost of material consumed. During FY23, the cost of material consumed increased to ₹62,179.91 crores from ₹42,890.12 crores in FY22, an increase of approximately 45%.
  • Higher inventory cost. In FY23, inventory turnover days increased by 22 days, which had an impact on working capital.
  • Slowdowns in key markets, including China, the US, the UK, and Europe, adversely impacted steel prices. The steel prices remained volatile, with downward pressure during FY23.
  • The company had to depend on the import of coking coal to power its steel plant. In FY22, out of the total requirement of 17.2 MT, the company had to import 15.92 MT. Supply-chain woes due to the Russia-Ukraine war, the prices of imports jumped significantly.

SAIL Share Price Growth Potential

SAIL expects a 15% year-on-year increase in sales volume to 18.7 MT in FY24. It is also expected to benefit from the lower price of coking coal.

The company is undertaking a huge capex plan of ₹1 lakh crore in the next 9 to 10 years and increasing its manufacturing capacity to 30 MT by 2030.

India’s steel sector may benefit from the country’s strong growth momentum. According to the Indian Steel Association (ISA), steel demand in India will increase by 8-9  MT per year over the next two fiscal years, owing to strong momentum in infrastructure spending and sustained growth in urban consumption.

Global Outlook

FY24 will likely be a better year for steel companies on the back of global economic recovery. The IMF has projected global real GDP growth at 3% in 2023, up 0.2% from its April forecast.

However, one of the concerns is sluggish domestic demand in China, which is likely to keep global steel prices under pressure. China’s massive steel industry has been hard hit by the country’s massive slowdown in the property sector, pushing steel prices to three-year lows in May. The country is also exporting its surplus steel. In the first five months, China’s steel exports were up by 41% compared to the previous year.

China is the world leader in steel manufacturing capacity accounting for 54% of the world’s steel production in 2022. As Indian steel prices follow international steel prices, the sector may remain under pressure until there is a strong global recovery, particularly in China’s domestic demand.

*Disclaimer Note: The securities quoted, if any, are for illustration only and are not recommendatory. This article is for education purposes only and shall not be considered as recommendation or investment advice by Research & Ranking. We will not be liable for any losses that may occur. Investment in securities market are subject to market risks. Read all the related documents carefully before investing. Registration granted by SEBI, membership of BASL, and certification from NISM in no way guarantee the performance of the intermediary or provide any assurance of returns to investors.

FAQs

When was SAIL established?

SAIL was incorporated in the year 24th January 1973 with an authorized capital of ₹2000 crores as a holding company to manage the government-owned five integrated steel plants in the country. In 1978, through significant restructuring of the company, SAIL transformed into an operating company.

What are the five steel plants of SAIL?

SAIL operates through five integrated steel plants at Bokaro, Rourkela, Durgapur, Burnpur, and Bhilai. The combined capacity of all steel plants is around 19.5 MT by the end of 2022.

How has SAIL share price performed in the last 5 years?

As of August 12, 2023, the SAIL share price has delivered a CAGR return of 3% over the past five years and an impressive 33% over the last three years. all-time high of ₹151.30 on May 10, 2021. The stock has subsequently experienced a notable decline and has been unable to surpass that peak.

Read more:  How Long-term investing helps create life-changing wealth – TOI

No more posts to show

Frequently asked questions

Get answers to the most pertinent questions on your mind now.

An investment advisory firm is a company that helps investors make decisions about buying and selling securities (like stocks) in exchange for a fee. They can advise clients directly or provide advisory reports and other publications about specific securities, such as high growth stock recommendations. Some firms use both methods, like Research & Ranking, India’s leading stock advisory company, specializing in smart investments and long-term stocks since 2015.

An investment advisory firm is a company that helps investors make decisions about buying and selling securities (like stocks) in exchange for a fee. They can advise clients directly or provide advisory reports and other publications about specific securities, such as high growth stock recommendations. Some firms use both methods, like Research & Ranking, India’s leading stock advisory company, specializing in smart investments and long-term stocks since 2015.
What is an Investment Advisory Firm?

An investment advisory firm is a company that helps investors make decisions about buying and selling securities (like stocks) in exchange for a fee. They can advise clients directly or provide advisory reports and other publications about specific securities, such as high growth stock recommendations. Some firms use both methods, like Research & Ranking, India’s leading stock advisory company, specializing in smart investments and long-term stocks since 2015.

An investment advisory firm is a company that helps investors make decisions about buying and selling securities (like stocks) in exchange for a fee. They can advise clients directly or provide advisory reports and other publications about specific securities, such as high growth stock recommendations. Some firms use both methods, like Research & Ranking, India’s leading stock advisory company, specializing in smart investments and long-term stocks since 2015.

An investment advisory firm is a company that helps investors make decisions about buying and selling securities (like stocks) in exchange for a fee. They can advise clients directly or provide advisory reports and other publications about specific securities, such as high growth stock recommendations. Some firms use both methods, like Research & Ranking, India’s leading stock advisory company, specializing in smart investments and long-term stocks since 2015.

An investment advisory firm is a company that helps investors make decisions about buying and selling securities (like stocks) in exchange for a fee. They can advise clients directly or provide advisory reports and other publications about specific securities, such as high growth stock recommendations. Some firms use both methods, like Research & Ranking, India’s leading stock advisory company, specializing in smart investments and long-term stocks since 2015.

Who we are

SEBI registered investment advisory services

Media, Award & Accolades

Stay updated with our winning journey

Video Gallery

Watch our exclusively curated financial videos

Performance

Know the journey of stocks

Newsletters

Stay on top of the stock market

Contact us

Stay in touch

5 in 5 Strategy

A portfolio of 20-25 potential high-return stocks

MPO

1 high-growth stock recommendation/ month, that is trading below its intrinsic value

Combo

A combined solution of 5-in-5 wealth creation strategy & mispriced opportunities

Dhanwaan

Manage your portfolio with dhanwaan

Informed InvestoRR

A step by step guide to sharpen your investing skills

EPW Coming soon

A concentrated portfolio of 12-18 high-growth & emerging theme stocks

Pricing

Choose from our range of pricing packages