1. Home
  2. Blog
  3. Fundamental Analysis of Stocks
  4. Page 2

Fundamental Analysis of Stocks

Know company background, financials, & more

Have you ever noticed how everyday items have become more comfortable in recent years, with ergonomic designs that feel right […]

Have you ever noticed how everyday items have become more comfortable in recent years, with ergonomic designs that feel right in your hand? Or the increasing reliability of our communication networks and healthcare systems?

The combination of design and technology has helped companies create innovative products that are easy to use and positively impact people’s lives. And companies like Tata Elxsi play a considerable role. The world’s leading provider of design and technology services across industries.

In this article, we will do a company analysis of Tata Elxsi Ltd. and check out its share price history.

Overview of Tata Elxsi Ltd.

Tata Elxsi commenced its business on 5 May 1989 in Bangalore and is mainly involved in developing and promoting electronics, embedded systems, and software applications. Over the years, it has evolved its business structure and offering and is recognized as a premium engineering service provider globally.

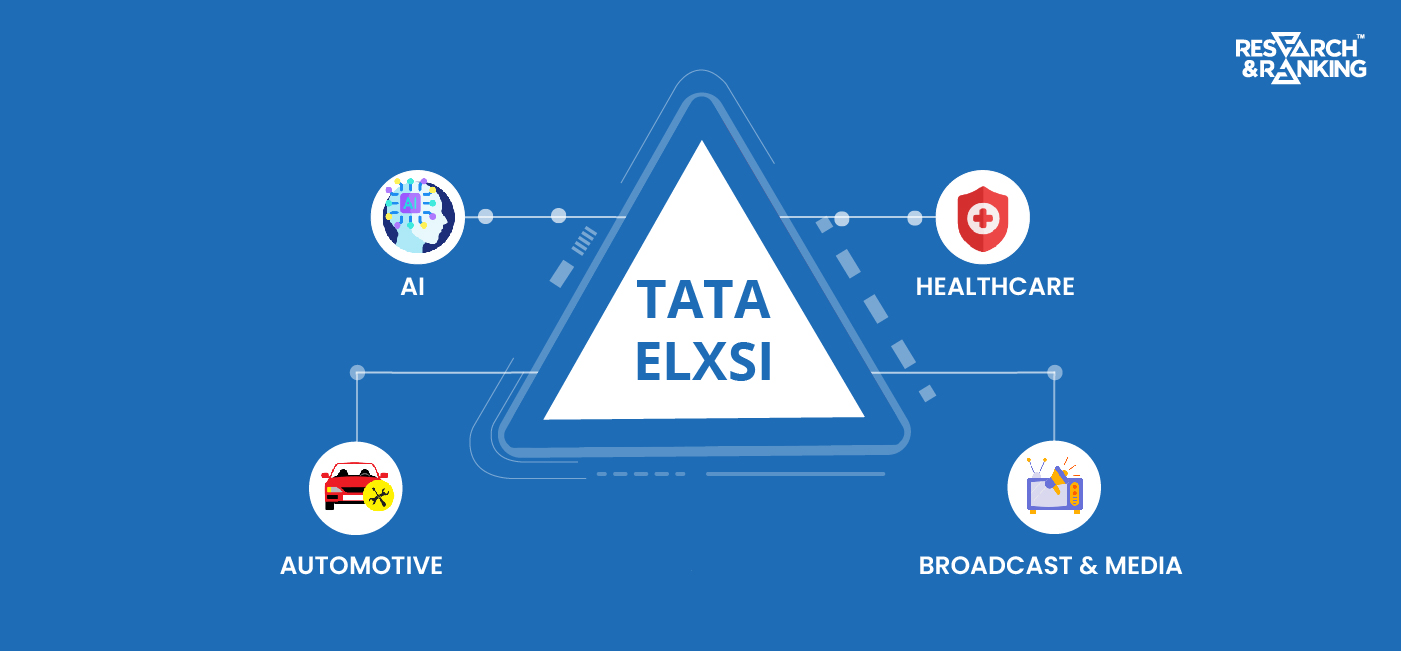
The company operates across various industries and offers a diverse set of services, such as:

Product Design and Engineering: The company helps its clients develop innovative and aesthetically designed products across industries such as automotive, healthcare, consumer electronics, railways, and more. It offers mechanical design, 3D modeling, simulation, and prototyping to develop physical products and components.

Embedded Systems and Software: Tata Elxsi specializes in developing embedded software and firmware for different applications. Embedded software and firmware is a type of software that controls hardware devices but not computers. For example, remote controls, in-vehicle computers, digital cameras, IoT devices, etc. It offers software for testing and quality assurance services for checking the performance and reliability of software and embedded systems.

Automotive and Transportation Solutions: It assists companies in product design and development, including interior, connected systems, infotainment systems, etc., and advanced systems related to autonomous vehicles, electric mobility, etc.

Broadcast and Communication: In the broadcasting and media industry, it offers services, including content creation, digital transformation, and streaming solutions.

Similarly, in the communications segment, it provides services like infrastructure design, network management, signal processing, and wireless protocol solutions for telecom operators.

Healthcare and Life Sciences: It offers design and development of medical devices, healthcare software, telemedicine solutions, healthcare IT services like electronic health record (EHR) implementation, data analytics, etc.

Tata Elxsi also leverages Artificial Intelligence (AI) and Machine Learning (ML) to develop solutions for various industries, such as predictive maintenance, data analytics, voice and speech recognition, etc. It also offers services to the Aerospace and Defense industry, semiconductors, etc.

Tata Elxsi Business Overview

As defined in the Accounting Standard 108- operating segments, the company has identified two business segments:

  • Software Development & Services
  • System Integration & Support Services

In FY23, Tata Elxsi reported a total revenue of ₹3,218.5 crores and has earned a significant share of the revenue from the transportation vertical, followed by media & communication and healthcare.

image 43

Tata Elxsi Management Team

Tata Elxsi has a workforce of over 12,000 people spread across 16 countries. The company is led by:

  • Mr. Manoj Raghavan, who is the Managing Director & CEO. He has been with the company since 1997 and began his career with the Tata Group in 1993 as a Graduate Trainee Engineer at Tata Motors.
  • Mr. Nitin Pai is the CMO and Chief Strategy Officer. He joined Tata Elxsi in 1996 as a product manager and has held various leadership roles in the marketing and design division. Mr. Pai is a Mechanical Engineer from BITS Pilani.
  • Mr. Gaurav Bajaj is the Chief Financial Officer at Tata Elxsi. He joined Tata Elxsi in January 2021, previously working for Wipro Ltd. Mr. Gaurav is an ICAI-certified chartered accountant.
  • Mr. Philip Mammen is the Vice President- Human Resources and has been with the company since January 2007.

Shareholding Pattern

image 44

Tata Elxsi Financial Review

Revenue

In FY23, Tata Elxsi reported a 27.9% year-on-year rise in revenue to ₹3,218.5 crores from 2,515.3 crores in FY22. And, in Q1FY24, total income rose by 18.5% to ₹872.5 crores, from ₹736.2 crores in Q1FY23.

image 53

Segment-wise Revenue Breakup

 FY22 (in ₹ cr)FY23 (in ₹ cr)Q1FY23 (in ₹ cr)Q1FY24 (in ₹ cr)
Software Development & Services  2421.313,065.94710.85827.46
System Integration & Support Services  494.8787.7515.0322.80

Geographic-wise Revenue Breakup

 FY22 (in ₹ cr)FY23 (in ₹ cr)Growth
India393.07521.5432.68%
US1041.631322.7226.99%
Europe755.771139.5050.77%
Others280.31160.94-42.58%

EBITDA

In FY23, the company reported an EBITDA of ₹961.1 crores, an increase of 25.5% year-over-year, compared to ₹765.7 crores in FY22. The EBITDA margin in FY23 was 30.6%, compared to 31% in FY22. In Q1FY24, EBITDA witnessed a year-on-year growth of 5.6% to ₹251.5 crores from ₹238.2 crores.

image 56

Profit After Tax

In FY23, Tata Elxsi Ltd. reported a 37.4% year-on-year rise in net profit to ₹755.2 crores from ₹549.7 crores. In Q1FY24, the company reported a 2.2% increase in net profit to ₹188.9 crores from ₹184.7 crores.

image 57

Tata Elxsi Key Financial Ratios 

Current Ratio: At the end of FY23, the current ratio stood at 4.83 times, compared to 4.13 times at the end of FY22.

Debt-to-equity Ratio: The company has no long-term debt, and the debt-to-equity ratio is stable at 0.09 times at the end of FY23.

Net Profit Margin: In FY23, the net profit margin increased to 24.01% from 22.25% in FY22.

Return on Equity (ROE): The ROE of the company at the end of FY23 was 40.97%, compared to 37.23% at the end of FY22.

Return on Capital Employed (ROCE): The ROCE of the company declined slightly to 42.05% at the end of FY23, compared to 43.4% at the end of FY22.

Tata Elxsi Share Price History

Tata Elxsi has given a stellar return to investors, becoming a tremendous success. It launched its IPO in 1995, and from September 1995, the stock has surged from ₹13.5 to reach an all-time high of ₹10,760 in August 2021.

If an investor had invested ₹1 lakh in this stock in September 1995 and remained invested during this period, the value of the stock would have turned more than ₹13 crores today.

tata elxsi
Source: TradingView

The company issued bonus shares in the ratio of 1:1 on 18th September 2017 and has a consistent track record of paying dividends to shareholders. It paid ₹24 in 2021, ₹42.50 in 2022, and ₹60.60 in 2023 as dividends.

As of 27 September, Tata Elxsi share price has given a CAGR return of 45% and 79% in the last five and three years, respectively. The market cap of the company at this date is ₹45,466 crores.

Tata Elxsi Ltd. Company Analysis

Tata Elxsi has experienced remarkable growth since its establishment, continuously evolving to adapt to changing times and shifting customer preferences. Its growth journey over the years is divided into four stages:

Gen 1 was between FY94 and FY03, wherein the company focused on developing system integration services (SI) and Engineering, Research & Development (ER&D).

Gen 2 growth stage lasted from FY04 to FY13; the company launched the Industrial Design business and Visual Computing Labs for visualization and animation.

In the Gen 3 growth stage, which lasted from FY14 to FY19, the company merged the VLC division with Industrial Design, entered the medical electronics business, and achieved leadership in Auto, Media, and Communication.

Gen 4: In its ongoing growth stage from FY20, the company is now focusing on Design-led Engineering for scaling growth. During this period, the CAGR growth in revenue has been 24.5%.

Financial Performance Review

Tata Elxsi is majorly earning from three verticals- Transportation, Healthcare, and Media & Communications.

Transportation

During FY23, The company’s transportation business grew by 32.7% and contributed ₹1,177 crores to the revenue, aided by large deals and growth across segments like EV, software-defined vehicles, and connected cars. The company is a leading provider of transformative technologies for connected, autonomous, and electric cars, with solutions like the AUTONOMIA platform for driverless cars and Tata Elxsi’s e-Cockpit. Besides, it has a vast suite of EV solutions, electric motor solutions, and battery management systems.

Media & Communications

The media & communications division posted 18.5% year-on-year growth, generating ₹1,132.2 crores in revenue. In media, the company has benefitted from the shift towards digital streaming and services. Its award-winning solutions help streaming platforms and media companies stay on top of the game, including content curation. The growing availability of 5G networks has also created an enormous opportunity and has won strategic deals from leading operators from EMEA and a leading multi-system operator in North America.

Healthcare

In FY23, the healthcare division posted strong year-on-year growth of 37.6%, contributing ₹423.5 crore to the top line. The company is offering services in the areas of digital and connected healthcare. And solutions like TEngage and TEDREG help pharmaceutical companies to monitor and capture real-time updates to global healthcare standards.

Key Highlights from Earning Calls

  • Deal closure in Q1FY24 has been slow in the transportation segment and affects revenue growth. The management is hopeful of an accelerated deal pipeline closing in the next two quarters.
  • The media and communication segment is witnessing a slowdown, affecting revenue growth.
  • The healthcare division recorded a sequential growth of 3.4%, a significant improvement over the last two quarters. The company is hopeful to continue the growth momentum in subsequent quarters on the back of good new deals and product wins.
  • Operating margins fell 341 basis points sequentially in Q1FY24 to 27.05%, owing primarily to higher employee costs and subcontracting expenses. However, management expects that margins will improve in the coming quarters. This will be driven by increasing employee utilization from 72.5% to 80% and decreasing subcontracting expenses.
  • In FY24, the company plans to hire 1800-2000 employees, and despite the uncertain demand outlook, the management is hopeful of strong deal wins and client transformation in the industry.

*Disclaimer Note: The securities quoted, if any, are for illustration only and are not recommendatory. This article is for education purposes only and shall not be considered as recommendation or investment advice by Research & Ranking. We will not be liable for any losses that may occur. Investment in securities market are subject to market risks. Read all the related documents carefully before investing. Registration granted by SEBI, membership of BASL, and certification from NISM in no way guarantee the performance of the intermediary or provide any assurance of returns to investors.

FAQs

Is Tata Elxsi the same as TCS?

No, TCS and Tata Elxsi are different companies with different domain expertise. Tata Elxsi is a product development company n the automotive, healthcare, and media & communications industries. TCS is an IT services company.

How has Tata Elxsi share price performed in the last five years?

As of 27th April 2023, Tata Elxsi share price has given a CAGR return of 45% and 79% in the last five and three years respectively. It made an all-time high level of ₹10,760 in August 2021.

When was Tata Elxsi established?

Tata Elxsi was incorporated on 5th May 1989 in Bangalore and is primarily involved in the development and promotion of electronics, embedded systems, and software applications.

Introduction In a fiercely competitive market, where large and multinational retail chains are struggling to dominate and be profitable, Avenue […]

Introduction

In a fiercely competitive market, where large and multinational retail chains are struggling to dominate and be profitable, Avenue Supermarts, the operator of the D-Mart retail stores, is not only thriving but has set a benchmark in efficiency and profitability.

From its humble beginning in the early 2000s, D-Mart has become one of India’s most successful and rapidly expanding retail chains. This article will help us understand the fundamentals of Avenue Supermart.

History of Avenue Supermart

DMart, short for Damani Mart, was founded by investor and entrepreneur Radhakishan Damani and his family in 2000. The first DMart store was opened in Powai in 2002 with a straightforward vision, to provide customers with a wide range of products at affordable prices. DMart is in 10 states, one union territory, and NCR with 324 stores.

DMart initially chose to expand its store network within Maharashtra. It took eight years for the company to open its first ten stores before scaling up its operations and expanding to other states.

It followed a cluster-based expansion strategy, focusing on deepening its penetration, where it was already present before moving to newer regions. The success of DMart’s growth is attributed to multiple factors, including its everyday low pricing strategy for products, store format, supply chain management, and customer-centric approach.

Business Overview of Avenue Supermart

DMart offers its customers a mix of everyday-use items with a prudent product mix across all stores in three categories- Food, Non-Food, and General Merchandise and Apparel.

The company sells all its products through offline and online modes. Avenue Supermarts allows its customers to shop online through its mobile app and website, www.dmart.in. In accordance with the Indian Accounting Standard 108, all business activities of the company primarily fall under a single segment of “retail,” and all its revenues originate from within India.

Key Management Personnel

  • Mr. Ignatius Navil Noronha is the Managing Director and CEO and has been with the company since 2004. He is a graduate of the Narsee Monjee Institute of Management Studies.
  • Mr. Ramakant Baheti is the Whole-time Director and Group CFO at Avenue Supermarts and has been with the company since its inception. He is a qualified Chartered Accountant from ICAI.
  • Mr. Narayan Bhaskaran is the Chief Operating Officer (COO) and oversees the company’s supply chain management. He joined Avenue Supermarts as Vice President HR in May 2008 and was promoted to COO in September 2016. Mr. Bhaskaran has done post-graduation in human resource management from XLRI, Jamshedpur, and is also a qualified Company Secretary.
  • Mr. Niladri Deb is the Chief Financial Officer and joined the company in 2018. He is a qualified Chartered Accountant and also did management-related courses from IIM-Ahmedabad. Earlier, he was with The Kraft Heinz Company, ITC, and Usha International.
  • Mr. Trivikrama Rao Dasu is the CEO- of Avenue E-Commerce Limited. He looks after the entire e-commerce operations of the company.

Shareholding Pattern

image 31
Source: DMart Annual Report

Financials

Revenue

In FY23, the company reported a 38% year-on-year increase in consolidated revenue from operations to ₹41,833 crores, from ₹30,353 crores in FY22. In Q1FY24, revenue from operations came in at ₹11,865.44 crores, up 18.2% from ₹10,038.07 crores in Q1FY23.

image 28
Source: DMart Annual Report
image 32

EBITDA

In FY23, the company reported a 46% year-on-year increase in EBITDA to ₹3,659 crores from ₹2,502 crores in FY22. And, in Q1FY24, DMart’s EBITDA was ₹1,035.3 crores, up 2.8% year-on-year, compared to ₹1,008 crores in the same period last year.

image 29
Source: DMart Annual Report
 FY19FY20FY21FY22FY23
EBITDA Margin (in %)8.28.67.38.28.7

Net Profit

In FY23, the company’s net profit increased by 58% year-on-year to ₹2,556 crores from ₹1,616 crores. And, in Q1FY24, net profit increased by 2.3% to ₹658.71 crores from ₹642.89 crores in Q1FY23.

image 30
 FY19FY20FY21FY22FY23
Net Profit Margin (in %)4.75.54.95.36.1
Source: DMart Annual Report

Key Financial Ratios

Current Ratio: The current ratio increased 4 times at the end of FY23 from 3.06 times in FY22. The ratio increased because fixed deposits held with the bank last year were reclassified as a current asset in FY23.

Debt-to-equity Ratio: The company has no long-term debt on its book, and the debt-to-equity ratio is stable at 0.03 times as of 31st March 2023.

Interest Coverage Ratio: The interest coverage ratio was 68.22 times at the end of FY23, up from 56.09 times at the end of FY22.

Inventory Turnover Ratio: The inventory turnover ratio in FY23 was 14.83 times, up from 12.77 times in FY22.

Operating Profit Margin: The operating profit margin in FY23 was 7.84%, up from 7.32% in FY22.

Net Profit Margin: The net profit margin was 6.11% in FY23, up from 5.32% in FY22.

Return on Capital Employed (ROCE): The ROCE of the company improved to 21.50% at the end of FY23, up from 17.37% at the end of FY22.

Return on Equity (ROE): The ROE stands at 16.8% in FY23, up from 12.32% at the end of FY22 due to increased earnings.

DMart Share Price Analysis

DMart launched its IPO on March 8th, 2017, and was the most successful issue in the market. The IPO was issued at a price band of ₹295 to ₹299 per share and oversubscribed by 104.5 times, receiving bids for 463.61 crore shares against the total issue size of 4.43 crore. The shares were listed on March 21, 2017, at ₹604.7 per share, up 102% over the issue price.

DMart
Source: TradingView

In the last five years, DMart share price has given a CAGR return of 20%, rising from around ₹1,200 level, and as of 21st September 2023, it is trading at around ₹3,680 level. It made an all-time high level of ₹5,900 on 18th October 2021.

In its listing history, the company has not issued any dividends or bonus shares to its investors. As of 21st September 2023, the market capitalization of Avenue Supermarts is close to ₹2.4 lakh crore.

Avenue Supermarts Company Analysis

Avenue Supermarts has recovered after being severely impacted by COVID-19 in terms of sales, and both growth and demand have now surpassed pre-COVID levels in FY23. Total bill cuts in FY23 were 25.8 crores, which dropped from 20.1 crores in FY20 to 15.2 crores in FY21.

The revenue from sales per retail business area sq ft was ₹31,096 in FY23, which is still below the FY19 level of ₹35,647. During this period, the company expanded to new geographies, and the store count went up from 176 to 324, taking up the retail business area from 5.9 million to 13.4 million sq. ft.

Financial Performance

In FY23, the company showcased a turnaround in financial performance with a 38% annual increase in the top line to ₹42,839.56 crore, and the bottom line increased by 58% to ₹2,556 crores. The net profit margin improved by 210 bps from 4.9% in FY21 to 6.1% in FY23, as the company recovered from the Covid-19 pandemic slowdown and drop in demand.

However, the company’s General Merchandise and Apparel Category continues to witness sales weakness. Generally, the merchandise and apparel category is where the margin is highest compared to the foods and non-foods category.

In FY19 and FY20, the revenue contribution share from General Merchandise and Apparel was 28.29% and 27.31%, respectively, which fell to 23.04% in FY23. Also, the company struggles to increase the revenue share contribution in the non-foods category, around 20%.

Operational Performance

The company in FY23 added 1.9 million sq ft, and sales revenue inched higher from ₹27,454 per sq. ft. to ₹31,096 per sq. ft. Still, it is below the pre-Covid levels, which used to be ₹35,647 per sq. ft. in FY19.

As per the management commentary, recent expansion to other states and larger store sizes resulted in a drop in revenue per sq. ft.

Inventory Days, which shows how long products are in storage before they are sold, are coming down. From 36.5 days in FY21, it has dropped to 28.8 days in FY23. The drop is due to changes in product mix in recent years. It has reduced its inventory levels in the General Merchandise and Apparel category and increased inventory levels in the Food and Non-food categories.

The company is reorganizing its merchandise and apparel businesses, focusing on less aspirational products such as daily wear and less on the fashion apparel category in the ₹500-600 price range.

E-commerce Business

DMart Ready, the company’s e-commerce division, reported a total revenue of ₹2,202.03 crores in FY23, compared to ₹1,667.21 crores in FY22. It reported a loss of ₹193.07 crores and ₹142.07 crores in FY23 and FY22, respectively. The company operates its e-commerce services in 22 cities and focuses on increasing efficiency in the Mumbai Metropolitan Region.

As per management commentary, there is little room for losing money in the e-commerce segment and the growth in the e-commerce division is not impacting the revenue growth in physical stores.

Expansion

The company follows a cluster-based expansion approach, strengthening its presence in existing areas before moving to new regions. It increases the operating leverage. The entry of other big players like Reliance results in stiff competition in existing and new regions.

DMart is currently experiencing high real estate costs and a lack of availability of large store sizes that impact store sizes. The company has also ventured into the pharmacy business, opening its first outlet in Mumbai. And looks to scale it up as it requires less shelf space and high productivity.

*Disclaimer Note: The securities quoted, if any, are for illustration only and are not recommendatory. This article is for education purposes only and shall not be considered as recommendation or investment advice by Research & Ranking. We will not be liable for any losses that may occur. Investment in securities market are subject to market risks. Read all the related documents carefully before investing. Registration granted by SEBI, membership of BASL, and certification from NISM in no way guarantee the performance of the intermediary or provide any assurance of returns to investors.

FAQs

  1. How has DMart share price performed in the last five years?

    As of 21st September 2023, DMart share price has given a CAGR return of 20% in the last five years. It made an all-time high of ₹5,900 on 18th October 2021.

  2. When was DMart founded?

    DMart was founded in the year 2000 by Radhakishan Damani. It opened its first store in 2002 in Mumbai. As of 21st September 2023, the company has 327 stores across 10 states, one union territory, and NCR.

  3. Are Avenue Supermarts and DMart the same?

    Yes, they both are the same. Avenue Supermarts owns and operates the DMart supermarket chain.

Introduction India is known as the “Pharmacy of the World” because of its ability to produce high-quality, low-cost generic and […]

Introduction

India is known as the “Pharmacy of the World” because of its ability to produce high-quality, low-cost generic and specialty drugs. The country’s pharmaceutical industry ranks the third largest globally in production volume and 13th by value. India exports pharmaceutical products to more than 200 countries, underlining its global footprint in the industry.

Many companies have helped India to earn this coveted title. Sun Pharma, Dr. Reddy’s, Cipla, Lupin, Mankind Pharma, Biocon, Torrent Pharma, and many others started from modest beginnings. However, their founders’ grit and determination helped them become industry leaders.

This article will explain more about Lupin Limited, the Mumbai-based pharmaceutical company known for its anti-TB and diabetics drugs.

History of Lupin Limited

Every significant achievement we see today has its origins in humble beginnings. Lupin was founded by Dr. Desh Bandhu Gupta (DBG) in 1968 with ₹5,000 borrowed from his wife. Before starting Lupin, DBG had no experience in the pharma field and was a professor of science at BITS, Pilani.

DBG named the company after the Lupin flower, which grows and sustains in harsh conditions and nourishes the soil. This nature’s selfless act inspired DBG to start in the pharmaceutical sector and address unmet medical needs.

The company commenced operations as a manufacturer of vitamins. It supplied iron and folic acid tablets for the Government of India’s flagship programs aimed at improving the health of mothers and children. Later, DBG’s strong desire to reduce the impact of TB in India led to Lupin’s foray into manufacturing anti-TB drugs, the decision that accelerated the company’s growth path.

Over the years, through a series of organic and inorganic initiatives, Lupin has grown from a two-employee company to an employee footprint of more than 21,000 heads that spans 11 countries across six continents.

Today, Lupin is the 13th largest generic company in the world, with annual sales of $2 billion in FY23. Region-wise, Lupin is the third-largest in the US by prescriptions, sixth-largest in the Indian pharma market, fourth-largest in Australia, and eighth-largest in South Africa.

Performance Creative 4

Build your well-diversified portfolio

Create wealth now!

Build your well-diversified portfolio

Create wealth now!

Lupin Business Overview

Lupin has 15 manufacturing sites and seven R&D sites across India, the US, the Netherlands, Brazil, and Mexico. The products and offerings of the company include:

  • Key Therapeutic Areas: This includes multi-drug resistant TB, diabetes, cardiology, respiratory, central nervous system disorders, ophthalmology, and others.
  • Generics: Lupin is a strong player in the generics market, with a product footprint in more than 100 countries. In the US, 70% of its generic portfolio ranks amongst the top three in their respective categories, and in India, several Lupin generic brands are ranked in the top 300 brands.
  • Specialty Drugs: The company’s specialty business divisions are located in the US and Europe, where it has carved a niche in the women’s health and neurology segments.
  • Over-the-counter (OTC): Lupin’s OTC portfolio includes products from bowel regulators, feminine hygiene, health supplements, and personal sanitization products.
  • Active Pharmaceutical Ingredients (APIs): Lupin is the leading API manufacturer supplying to more than 70 countries. The company is among the top API manufacturers of antiretrovirals, antimalarials, and first-line TB treatment drugs.
  • Biosimilars: Similar generic drugs made from chemicals; biosimilar products are made from biological (natural) sources. Lupin introduced this segment in its product line in 2008 and produces high-quality biologics that are accessible and affordable globally. Its oncology biosimilars enjoy a high market share in India.

As reported under IND AS 115, the group’s operations are limited primarily to one segment: “pharmaceuticals and related products.”

Key Management Personnel

  • Mrs. Manju D Gupta is the Chairman (Non-Executive) of the company and has been a member of the Board since its incorporation.
  • Ms. Vinita Gupta, the company’s Chief Executive Officer, joined the company in 1997. She has played an instrumental role in shaping the company’s growth strategy. Ms. Gupta is a pharmacy graduate from the University of Mumbai and holds an MBA from the Kellogg School of Management at Northwestern University, Illinois.
  • Mr. Nilesh D Gupta is the company’s Managing Director and joined Lupin in 2002. He is responsible for the company’s research, supply chain, manufacturing, quality, and regulatory operations. Mr. Nilesh is a Chemical Engineer from the University Department of Chemical Technology (UDCT), Mumbai, and holds an MBA from The Wharton School, University of Pennsylvania.
  • Mr. Ramesh Swaminathan is the company’s Executive Director, Global CFO, and Head of Corporate Affairs. On March 26, 2000, he began working for the company. Mr. Swaminathan is a CA, CS, ICWAI, and Chartered Management Accountant, UK. He has also completed the Senior Management Program at INSEAD in France and is a Lord Chevening Scholar in the UK.

Lupin Shareholding Pattern

image 118

Lupin Financials

Revenue

In FY23, Lupin reported a slight 1% rise in total revenue to ₹16,715 crores from ₹16,547 crores. And, in Q1FY24, the total revenue was ₹4,814 crores, up by 28.6% compared to ₹3,743.8 crores in Q1FY23.

image 120

Geographical Distribution of Revenue

 FY21 (in ₹ cr.)FY22 (in ₹ cr.)FY23 (in ₹ cr.)
India5,783.36,372.96,434.9
United States of America5,322.25,524.1  5,158.3
Others3,821.44,295.74,676.7

In FY23, the company’s EBITDA decreased by 18.9% to ₹1,871.5 crores from ₹2,307.3 crores in FY22. The EBITDA margin in FY23 is 11.5%, down from 14.2% in FY22. And, in Q1FY24, EBITDA was reported at ₹879.1 crores, up by 269% compared to ₹237.9 crores in Q1FY23.

Net Profit

In FY23, Lupin reported a net profit of ₹430 crores, compared to a loss of ₹1,528 crores in FY22. And, in Q1FY24, the company reported a net profit of ₹452.3 crores, over a loss of ₹89.1 crores in Q1 of last financial year.

image 121

Key Financial Metrics

Current Ratio: At the end of FY23, the company’s current ratio was 1.34 times, which declined from 1.51 times at the end of FY22.

Debt-to-equity Ratio: The company’s debt-to-equity ratio as of 31st March 2023 is 0.34 times.

Debt Service Coverage Ratio: The debt service coverage ratio at the end of FY23 improved significantly to 3.82 times from 0.20 at the end of FY22.

Return on Equity (ROE): The ROE at the end of FY23 grew to 0.03% from -0.12% at the end of FY22.

Return on Capital Employed (ROCE): At the end of FY23, the ROCE of the company was 0.08%, which increased marginally from 0.09% at the end of FY22.

Lupin Share Price History

Lupin has been listed on the stock market since June 20, 1993, when it came out with its public issue.

As one of the country’s leading pharma stocks, its stock has always been the focus of investors and traders. However, over the long term, the stock has underperformed the market. As of 11th September 2023, Lupin share price has given a CAGR return of 3% and 5% in the last five and three years, respectively.

Lupin

Lupin share price has increased from ₹635 on 19th September 2022 to a 52-week high level of ₹1,148 on 6th September 2023.

The company has a consistent track record of paying dividends to its shareholders. In the last three years, the company paid ₹4 in 2023, ₹4 in 2022, and ₹6.5 in 2021 as dividends.

Lupin did a bonus issue once on 11th August 2006 at a 1:1 ratio and a stock split on 27th August 2010 at a 10:2 ratio. This means that 100 shares allotted in the IPO have now turned into 1000 stocks with a face value of ₹2.

The company has a market capitalization of ₹51,279 crores as of 11th September 2023.

Fundamental Analysis of Lupin

Revenue and Profitability: The company’s revenue has increased by 2.19% over the last five years. However, in terms of profitability, the company made a net profit in only three of the previous five years. The company has been EBITDA positive during these years.

The loss of ₹1,528 crores in FY22 was due to deferred tax payout, a spike in input cost due to supply-chain constraints, forex losses, and a one-time impairment charge.

Growth Drivers

Lupin has a diverse portfolio of products and services in the generics, specialty, biosimilars, APIs, and OTC drugs. In FY23, the company’s India sales were 37%, US sales were 32%, and Emerging Market sales were 10% of total sales, and it continues to grow rapidly with new product launches.

The company has six R&D units and spent ₹1,280 crores in R&D expenditure in FY23, which was 7.69%. It has a total of 911 active patents.

Lupin has further planned to expand its complex generics and biosimilar portfolio and aims to strengthen its position with new launches in the regulated market by FY28. 70% of the U.S. FDA filing in FY24 is focused on complex dosage forms.

Risk & Challenges

Over the years, Lupin has strengthened its position in the market and brand equity. The company is world-leader in anti-TB drugs, the third-largest in the US in prescription drugs, and the sixth-largest in the Indian pharmacy market.

Lupin faces various risks and challenges in its business environment, such as regulatory uncertainties, patent expiries, and competition from other players in the market. The company’s is highly dependent on the US market, from where it earns one-third of its revenue. Increased cost pressure in the US market resulted in losses in FY22.

Since the company operates mainly in the generics segment, pricing pressure is constant from other players in the market, government, and other stakeholders. For example, the sales of the company’s flagship product, Glumetza, declined by 28% in 2021 due to increased competition and price erosion.

Similarly, delay in launch or securing approvals for new products could be a considerable risk as the company loses the price premium advantage.            

Key Con-call Takeaways Q1FY24

  • Added over 1,300 new sales forces in Q3 and Q4 of FY23 in India, the benefit of which is likely to start yielding results from Q2FY24. It is also likely to increase expenses.
  • Increased R&D spending on new platforms. Over 50% of the R&D spend goes towards biosimilars, injectables, and complex generics.
  • India’s growth may be slightly impacted in the short term due to the patent expiry of a key drug, Ondero, in August 2023.
  • US business continues to see margin expansion for the fourth straight quarter.
  • Net debt of the company reduced to ₹1,300 crores from ₹2,500 crore in Q1FY24.
  • The company has maintained a guidance of 18% or higher exit EBITDA margin. And full-year margin guidance of +15% in FY24 with double-digit revenue growth.

*Disclaimer Note: The securities quoted, if any, are for illustration only and are not recommendatory. This article is for education purposes only and shall not be considered as recommendation or investment advice by Research & Ranking. We will not be liable for any losses that may occur. Investment in securities market are subject to market risks. Read all the related documents carefully before investing. Registration granted by SEBI, membership of BASL, and certification from NISM in no way guarantee the performance of the intermediary or provide any assurance of returns to investors.

FAQs

  1. When was Lupin established?

    Lupin was established in 1968 on the day of Gudi Padwa by Dr. Desh Bandhu Gupta, popularly known as DBG in the pharma circle. Before founding Lupin, he was a professor of science at BITS, Pilani.

  2. How has Lupin share price performed in the last five years?

    As of 11th August 2023, Lupin share price has given a CAGR return of 3% in the last five years, underperforming the broader market and index like Nifty50.

  3. What does Lupin company do?

    Lupin is a global pharmaceutical company offering various products in the generics, specialty drugs, APIs, biosimilars, over-the-counter drugs, etc. It is the sixth-largest pharma company by sales in India and third-largest by prescription sales in the US.

Introduction Adani Group is India’s largest private Energy & Utility company, with a strong presence in Renewables, Power Generation, Transmission […]

Introduction

Adani Group is India’s largest private Energy & Utility company, with a strong presence in Renewables, Power Generation, Transmission & Distribution, and Gas Distribution.

This article explains more about Adani Gas, now known as Adani Total Gas Limited, which supplies natural gas to residential, commercial, industrial, and vehicle users through PNG and CNG. Let’s dive in.

Overview of Adani Gas

Adani Gas was incorporated on August 5th, 2005, as a subsidiary of Adani Enterprises Limited to venture into India’s natural gas distribution business.

The company was initially focused on setting up a city gas distribution pipeline network for supplying natural gas to residential, commercial, and industrial users in various cities across India.

It started operations by setting up domestic gas connections in Ahmedabad and started the development of the city gas network in Faridabad.

At the end of Q1 FY24, the company expanded its gas distribution network to 124 districts in India, with 7.28 lakh PNG home connections, 7,615 industrial and commercial connections, and 467 CNG stations. The company has completed 11,124 kilometers of gas pipeline across the country.

Adani Gas’s other business interests include E-mobility, which is building a network of EV charging points. Currently, it has 141 charging points across 40 sites. And the company’s new initiative includes setting up biomass units. It is constructing one of India’s largest Biomass projects in Barsana, Uttar Pradesh, and is expected to be functional by the end of FY24.

Induction of Strategic Investors

On February 29, 2020, Adani Gas inducted French energy giant Total Energies as a strategic investor in the company. Total Energies bought a 37.4% stake in the company for ₹5,512 crores.

Following the induction, the company changed its name to Adani Total Gas Limited.

Business Overview of Adani Gas

City Gas Distribution

Adani Gas is in 52 geographical areas across 17 states and two union territories. It

has four consumer types- industrial, commercial, domestic, and CNG.

Industrial users utilize boilers, thermic fluid heaters, heat treatment, casting, and forging. Commercial consumers include restaurants, hotels, shopping malls, hospitals, temples, etc.

Biogas

Adani Gas formed a wholly new subsidiary called Adani Total Energies Biomass Limited (ATBML) to focus on building CBG plants and enhancing the production of CBG. The development came after the government launched the Sustainable Alternative Towards Affordable Transportation (SATAT) scheme to increase CBG production and brought compressed biogas projects under priority sector lending.

The upcoming biogas plant in Barsana, Uttar Pradesh, will process 225 tonnes per day of feed processing with an output capacity of 12,000 KG of compressed biogas.

Performance Creative 4

Build your well-diversified portfolio

Create wealth now!

Build your well-diversified portfolio

Create wealth now!

e-Mobility

The e-mobility business, which houses the company’s charging infrastructure, is being developed through its newly created subsidiary, Adani Total Energies E-Mobility Limited. It is using the existing space available at CNG stations. The company offers customers diverse fuel feed options through this arrangement- CNG, Biogas, and Electric. The company has also launched charging infrastructure at all six Adani Group-managed airports, GIFT City, and other premium hotspots.

Under Indian Accounting Standard 108, the company reports all its revenue under one segment, i.e., Selling and Distribution of Natural Gas.

Key Management Personnel

Mr. Suresh P. Manglani is the Executive Director and CEO of the company. He has diversified leadership experience of over 31 years at the CXO level. Before joining Adani Total Gas Limited in September 2018, he worked as CFO- Petroleum Retail Business- Reliance Industries Limited and worked with GAIL and Mahanagar Gas Limited.

Mr. Parag Parikh is the company’s Chief Financial Officer (CFO) and joined the company in August 2019. Earlier, he was working with GMR Group as Group Head – Finance. He has a Masters in Commerce from the University of Mumbai and an MBA-Finance from Mumbai Educational Trust, MET League of Colleges.

Shareholding Pattern

image 106
Source: BSE India

Adani Group and TotalEnergies are both promoter groups of the company.

Financials

Revenue

In FY23, the company reported a 46.07% annual growth in revenue from operations at ₹4,683 crores, compared to ₹3,206 crores in FY22. And, in Q1FY24, the consolidated revenue from operations grew by 2.2% to ₹1,135 crores from ₹1,110.21 crores in Q1FY23.

Revenue from Operations 2
Source: Adani Gas Q1FY24_Results

EBITDA

In FY23, consolidated EBITDA increased by 11.29% to ₹907 crores from ₹815 crores in FY22. And, in Q1FY24, the consolidated EBITDA increased by 12% to ₹255 crore from ₹228 crore in Q1FY23. In the last 4 years, EBITDA has grown by a CAGR of 14%.

EBITDA
Source: Adani Gas Investor-Presentation

Net Profit

In FY23, Adani Gas reported a 5% year-on-year increase in net profit to ₹530 crores from ₹505 crores in FY22. The net profit margin was 11.32% in FY23 and 15.75% in FY22. And, in Q1FY24, net profits increased by 8.2% to ₹150.22 crores from ₹138.77 crores in Q1FY23. In the last four years, Net Profit of the company has grown by a CAGR of 23%.

Net Profit 1

Key Financial Ratios

Current Ratio: The current ratio improved by 59% to 0.39 times at the end of March 2023 from 0.25 times at the end of March 2022. The increase is primarily due to the rise in trade receivables and a change in the investment maturity period. 

Debt-to-equity Ratio: The debt-to-equity ratio increased by 14% at the end of FY23 to 0.47 times from 0.41 times at the end of FY22.

Interest Service Coverage Ratio: At the end of FY23, the interest service coverage ratio decreased by 27% to 10.11 times, from 13.88 times at the end of FY22. Higher interest costs lead to a decrease in the interest coverage ratio.

Return on Capital Employed (ROCE): As of 31st March 2023, ROCE declined to 21.6% from 24.5% in FY22. It was 27.9% in FY21.

Return on Equity (ROE): The ROE of the company was 19.7% at the end of FY23. It was 23% at the end of FY22.

Adani Gas Share Price Analysis

Adani Gas shares were listed on the stock market through the demerger process from Adani Enterprise Limited (AEL). The shares were listed on November 5th, 2018, at ₹72 apiece.

Before listing Adani Gas, the combined entity (AEL and Adani Gas) traded around ₹210 a share in September 2018.

The company has yet to complete 5 years in the stock market, but in the initial years, it has given superior returns to investors. The last three-year CAGR return of the stock is 46%.

In recent months, after the release of Hidenberg’s report on corporate misgovernance in the Adani Group, the stock has experienced extreme volatility. The Adani Gas share price fell from its all-time high level of ₹4,000; as of 15 September 2023, it traded at around ₹640.

image 104
Source: TradingView

In the last three financial years, the company has paid ₹0.25 a share as a dividend to its shareholders. As of 15 September 2023, the market cap of Adani Total Gas Limited is ₹69,986 crores.

SWOT Analysis

Strength

  • Adani Gas is India’s largest private compressed natural gas distribution company, with a presence across 17 states and two UTs.
  • The company is backed by Adani Group, which has a strong reputation for executing and managing the largest and most challenging infrastructure projects. In addition, the strategic partnership with Total provides it with global expertise, technology, and resources.
  • Adani Gas is a profitable company with solid growth potential. In FY23, the company’s revenue increased by 46% year-on-year to ₹4,683 crores. And net profit increased by 5% to ₹530 crores.

Weakness

  • Adani Gas faces stiff competition from established CGD players such as Indraprastha Gas Limited (IGL), GAIL, Mahanagar Gas Limited, Gujarat Gas Limited (GGL), and others, all of which have established and continue to expand their networks.
  • The company’s operation is limited to specific geographic locations and has lower margins than its peers.
  • Adani Total Gas has high capital expenditure and debt levels. In FY23, the company has invested ₹1,150 to create additional infrastructure and plans to invest ₹18,000 to ₹20,000 crores in the next 10 years to build infrastructure for the gas distribution business.

Opportunities

  • Adani Gas can leverage the increasing demand for natural gas in India. The government is looking to increase the share of natural gas in the Indian economy from 6% to 15% by 2030.
  • The government has launched various schemes like Pradhanmantri Ujjwala Yojana, Pradhan Mantri Urja Ganga Project, and City Gas Distribution (CGD) bidding rounds to improve and expand the availability of natural gas in India.
  • The company is also exploring new business opportunities in biogas, biofuel, biomass, hydrogen, EV charging stations, and manufacturing equipment related to CGD business.

Threats

  • Adani Gas faces regulatory risks and uncertainties related to the pricing and allocation of natural gas. PNGRB determines the pricing based on factors like international prices, domestic production costs, demand & supply dynamics, etc.
  • The company faces a considerable challenge in maintaining the vast pipeline network and infrastructure. Building a pipeline network for city gas distribution will require clearance and approvals at various central, state, and municipal levels. Any delay and disruption could lead to a deterioration of service quality.
  • Opening geographical areas where the company operates could lead to Adani Gas losing marketing exclusivity, impacting earnings.

*Disclaimer Note: The securities quoted, if any, are for illustration only and are not recommendatory. This article is for education purposes only and shall not be considered as recommendation or investment advice by Research & Ranking. We will not be liable for any losses that may occur. Investment in securities market are subject to market risks. Read all the related documents carefully before investing. Registration granted by SEBI, membership of BASL, and certification from NISM in no way guarantee the performance of the intermediary or provide any assurance of returns to investors.

FAQs

  1. Why did Adani Gas change its name to Adani Total Gas Limited?

    After the induction of Total Energies as a strategic investor into the company in February 2020, Adani Gas changed its name to Adani Total Gas Limited. Adani Gas and Total Energies hold a 37.4% stake in the company.

  2. How has Adani Gas share price performed in the last three years?

    As of 15 September 2023, Adani Gas share price has given a CAGR return of 46% in the last three years. The stock’s all-time high level is ₹4,000.

  3. What does Adani Gas do?

    Adani Gas distributes natural gas to domestic, industrial, and commercial customers through CNG for vehicles and piped natural gas (PNG).

Introduction In the last 10 years, Adani Group has emerged as a leading infrastructure and utility company in India, and […]

Introduction

In the last 10 years, Adani Group has emerged as a leading infrastructure and utility company in India, and its foundation for excellence was laid around 1995 when it forayed into the ports business. Through various organic and inorganic strategies, Adani Group has become a force to reckon with in the Indian power sector.

The group has some leading companies in the power sector, such as Adani Power, India’s most significant private thermal power producer, and Adani Green, India’s largest renewable energy company.

This article will analyze another company of the Adani Group in the power sector, Adani Transmission, now known as Adani Energy Solutions Limited, India’s largest private power transmission company.

Let’s get started.

History of Adani Transmission

2006: Adani Group’s journey in the power transmission sector began in 2006, but not as a business unit to earn profits. It had to put transmission lines in place to evacuate power from its Mundra thermal power plant to the substation. The dedicated transmission lines spanning more than 3800 cKMs were commissioned between Mundra – Dehgam, Mundra – Mohindergarh, and Tiroda -Warora. It laid the groundwork for Adani’s future foray into the power transmission business.

2014: The group had to put another transmission line spanning over 1200 CKMs in place to generate power from the Tiroda power plant.

2015: After studying the enormous business potential in the transmission sector, Adani Transmission Limited was carved out of Adani Enterprise Limited (AEL) in 2015.

2016: Adani Transmission pursued inorganic and organic ways to grow its transmission network. It acquired GMR’s transmission assets in Rajasthan.

2017: Adani Transmission bought Reliance Infrastructure’s transmission assets in Gujarat, Madhya Pradesh, and Maharashtra.

2018: It acquired Reliance Infrastructure’s power generation, transmission, and distribution businesses, ushering the group into the power distribution business. Through its subsidiary, Adani Electricity Mumbai Limited (AEML), the company currently serves 3 million customers in Mumbai suburbs.

2019: Adani Transmission bought KEC’s transmission assets in Rajasthan in 2019.

2023: In July 2023, Adani Transmission Limited changed its name to Adani Energy Solution Limited (AESL). Presently, AESL is the largest private power transmission company with a network of more than 19,820 CKMs of transmission lines with a network availability of 99.7%.

Adani Transmission (AESL) Business Overview

AESL has divided its business into four divisions:

  • Transmission
  • Distribution
  • Smart Metering
  • District Cooling

Transmission: AESL owns and operates various high voltage AC and DC transmission lines, substations of 132KV to 756 KV voltage level. At the end of Q1FY24, it had a transmission network length of 19,778 circuit KM with a power transformation capacity of 46,000 MVA. It has targeted increasing the transmission lines network to 30,000 cKM by 2030.

Distribution: It distributes electricity to over 3 million customers in Mumbai sub-urban regions and the Mundra-SEZ region. It meets nearly 2000 MW of power demand with more than 99.9% supply reliability.

Smart Metering: The company is undertaking projects in select regions in Mumbai, Andhra Pradesh, and Assam and has yet to generate revenue and profits.

District Cooling: Under the India Cooling Plan (2019) developed under the Ministry of Environment, Forest & Climate to encourage efficient cooling methods, such as District Cooling and Thermal Energy Storage, AESL has ventured into the district cooling domain.

Under the Indian AS-108, AESL has three reportable operating segments:

  • Transmission
  • Trading
  • Generation, Transmission, and Distribution (GTD) Business- This segment covers the revenue from AEML.

Key Management Personnel

  • Mr. Anil Sardana has been the Managing Director of Adani Energy Solutions Limited since May 2018 and was recently appointed as Managing Director of Adani Power, effective July 2020. He has over 40 years of experience in the power and telecommunications industries. Mr. Sardana was the MD of Tata Power for over seven years before joining AESL, and he has also worked for NTPC for over 15 years.
  • Mr. Bimal Dayal is the CEO of AESL Transmission Business. He brings 35 years of rich experience in the Telecom Network Industry, handling multiple business functions. Mr. Dayal worked as MD & CEO of Indus Towers Limited before joining AESL. He has also worked with Ericsson India and Qualcomm in leadership roles.
  • Mr. Kandarp Patel is the CEO of AESL Distribution Business and has more than two decades of experience in Power Trading, Fuel Management, Legal and Regulatory, and Commercial aspects of Power business. He started his career with Gujarat Electricity Board (GEB) and joined Adani Enterprise Limited (AEL) in 2004 to spearhead the company’s power trading business.
  • Mr. Rohit Soni is the CFO at AESL. He is a qualified Chartered Accountant and Harvard Business School, Boston, USA alumnus. Before joining AESL, he was in various leadership roles with Vedanta Group.

Shareholding Pattern

image 37
Source: AESL Investor Presentation Sept 2023

Financials

Revenue

In FY23, AESL reported an 18% year-on-year increase in revenue to ₹13,293 crores from ₹11,258 crores in FY22. And, in Q1FY24, the company reported a 16% increase in total income to ₹3,772 crores from ₹3,249.74 crores in Q1FY23.

image 40
Source: AESL Investor Presentation Sept 2023

Operating Segment-wise Revenue

 FY22 (in ₹ cr)FY23 (in ₹ cr)Q1FY23 (in ₹ cr)Q1FY24 (in ₹ cr)
Transmission3,469.333,945.16835.94926.19
GTD Business6,966.288,591.912,212.742,737.71
Trading821.91755.6583.200.01

EBITDA

During FY23, consolidated EBITDA increased by 11% to ₹6,101 crores from ₹5,493 crores in FY22. In Q1FY24, the consolidated EBITDA increased by 4% to ₹1,378 crore from ₹1,326 crore in Q1FY23. In the last five years, EBITDA has grown at 14.08% CAGR.

image 39
Source: AESL Equity Presentation September 2023

EBITDA Margin

 FY20FY21FY22FY23
EBITDA Margin (in %)40514946
Source: AESL Equity Presentation September 2023

Profit After Tax

In FY23, AESL reported a 4% year-on-year increase in net profit to ₹1,281 crores from ₹1,236 crores in FY22. And, in Q1FY24, net profits increased by 8% to ₹182 crores from ₹168 crores in Q1FY23.

image 38
Source: AESL Equity Presentation September 2023

Key Financial Ratios

Current Ratio: The current ratio at the end of June 2023 improved to 1.08 times from 0.88 at the end of June 2022.

Debt-to-equity Ratio: The debt-to-equity ratio stood at 2.74 times at the end of June 2023, compared to 2.72 times at the end of June 2022.

Debt Service Coverage Ratio: At the end of June 2023, the debt service coverage ratio increased to 1.19 times, 1 time at the end of Q1FY23.

Interest Service Coverage Ratio: In Q1FY24, the interest service coverage ratio improved to 1.56 times from 1.27 at the end of Q1FY23.

Return on Capital Employed (ROCE): In FY23, ROCE declined marginally to 9.57% from 9.72% in FY22.

Net Profit Margin: At the end of Q1FY24, the net profit margin declined to 4.82% from 5.18% at the end of Q1FY23.

Adani Transmission(Adani Energy Solution Limited) Share Price History

Adani Energy Solution Limited (erstwhile Adani Transmission) was listed on the stock exchanges by demerging the transmission business from Adani Enterprise Limited on 31st July 2015.

As of 1st September 2023, Adani Transmission share price has given a CAGR of 31% and 44% in the last five and three years, respectively. However, the stock has underperformed heavily in the previous year due to extreme volatility in Adani Group stocks after the release of the Hindenburg report. Adani Transmission share price has dropped from its all-time high of ₹4,326 level, and as of 1st September 2023, it is trading at ₹825 level.

image 34

Since listing on stock exchanges, the company has not announced dividend payments to shareholders or bonus issues. The market cap of Adani Energy Solutions Limited is ₹92,017 crores as of 1st September 2023.

Adani Energy Solutions Limited Fundamental Analysis

Transmission

AESL is the largest private player in the power transmission business, with its assets in 14 states. The company has the lowest O&M cost per CKM among Indian power utilities companies, with solid efficiency and system availability in line with global standards.

image 35

It has the highest EBITDA margin in transmission business across global utilities. Compared to American utility companies, which recorded an average EBITDA margin of 63% in 2022, AESL’s transmission business averaged 92%.

image 36

AESL has divided its transmission assets into two categories:

Section 63 (Fixed Tariff): Under it, AESL has 20 operating assets and 9 under-construction assets. From 20 operational assets, it gets a level tariff of ₹1,800 crore per annum. And, from under-construction assets, it expects to get ₹1,500 crores in level tariff.

Section 62 (RAB Assets): Under it, AESL has five transmission assets, four operating and one under construction. The combined worth regulatory asset base (RAB) is ₹17,900 crores.

The group has secured long-term annuity incomes with assets commissioned to last decades (35 years of concession life + 30 years). Also, the company has efficiency-linked incentives, which help to generate higher returns for its highest network availability.

Furthermore, the company has more than 50% sovereign-rate counterparties and no-throughput risks. This has given multi-year revenue visibility and predictability.

It helped the company to efficiently plan its capital management program. AESL has synced its debt to asset life, which has helped reduce the debt cost. The average debt maturity in the company’s books is 8.1 years in FY23. In the power transmission business, there is a business opportunity of more than ₹2,28,000 crores for the private sector in the next 10-15 years.

Distribution

AESL distributed electricity in the Mumbai region through its subsidiary AEML and to the Mundra SEZ zone through MPSEZ Utilities Limited (MUL).

The key characteristics of AESL’s distribution business are it has a pool of over 12 million consumers with a perpetual license period, no throughput risk due to RAB-based returns, and O&M costs are passed to customers.

It services 85% of Mumbai, touching two-thirds of households in the city with the lowest distribution losses in the country at 5.9%. And, in Mundra, it was 3.12%. The company also focuses on parallel distribution, where consumers can choose multiple power distributors. It has planned a capital outlay of ₹20,000 crores over 8 years and is targeting more than 20% of the total market size or 4.5 million customers.

Smart Metering

AESL’s smart metering initiative is currently in the implementation phase and encompasses seven contracts spanning three states. These contracts involve the installation of an impressive 16.2 million smart meters, with a total contract value of ₹19,700 crores.

The smart metering market presents enormous growth potential, with the government aiming to deploy a staggering 250 million meters by 2026, necessitating a significant capital investment of ₹2.2 lakh crores. Notably, AESL has secured a 31% market share from the 109 million smart meters that have been tendered thus far, positioning itself as a critical player in this emerging sector.

District Cooling

AESL has recently expanded its operations into the district cooling sector. This innovative approach involves the centralized production of chilled water, which is then distributed to various buildings through an underground network of pipes to facilitate the cooling process. The system is expected to save 80% electricity and 60% water compared to conventional cooling systems.

Given the massive demand for cooling services in the residential, industrial, data center, and airports, the growth prospects for district cooling is up-and-coming. AESL strategically targets the commercial real estate and industrial cooling segments, with the highest demand for cooling services.

Adani Transmission, or AESL, has a robust operational business performance. However, with a PE ratio of 74.6 (as of 1st Sept 2023), its stock may be relatively expensive compared to its peers. Deleveraging its balance sheet could help Adani Transmission improve its profitability metrics and ROE.

*Disclaimer Note: The securities quoted, if any, are for illustration only and are not recommendatory. This article is for education purposes only and shall not be considered as recommendation or investment advice by Research & Ranking. We will not be liable for any losses that may occur. Investment in securities market are subject to market risks. Read all the related documents carefully before investing. Registration granted by SEBI, membership of BASL, and certification from NISM in no way guarantee the performance of the intermediary or provide any assurance of returns to investors.

FAQs

  1. When were Adani Transmission shares listed on stock exchanges?

    Adani Transmission share was listed through demerging from its parent company, Adani Enterprise Limited (AEL), on 31st July 2015.

  2. How has Adani Transmission share price performed in the last five years?

    As of 1st September 2023, Adani Transmission share price has given a CAGR return of 31% in the last five years.

  3. Is Adani Transmission a profitable company?

    Yes, Adani Transmission is a profitable company with India’s highest operating efficiency. Its transmission business has generated an EBITDA of 92%, and profit after tax is ₹1,281 in FY23.

Introduction to HAL Hindustan Aeronautics Ltd. (HAL) is one of the oldest Indian companies specializing in aircraft and helicopter manufacturing […]

Introduction to HAL

Hindustan Aeronautics Ltd. (HAL) is one of the oldest Indian companies specializing in aircraft and helicopter manufacturing and related services, and it plays a strategic role in India’s defense program. It is also one of the world’s oldest and largest aerospace and defense manufacturers.

Let us understand what the company does and analyze the share price of HAL.

HAL Overview

Hindustan Aeronautics Ltd. (HAL) is a government-owned aerospace and defense company. They design, develop, manufacture, and supply aircraft, helicopters, avionics, and communications equipment for military and civil markets. The company was founded in Bangalore in 1940 by Walchand Hirachand and the Government of Mysore to manufacture aircraft in India.
HAL has 20 Production and 10 R&D Centres co-located with the Production Divisions. These divisions /R&D Centres are in ten locations in seven states nationwide.

These divisions are organized into five complexes with current & future operations given below:

  • Bangalore Complex (BC): Production and ROH (Repair and Overhaul) of Fixed-wing Aircraft and Engines (Indian and Western origin), Spacecraft Structures, Castings, Forgings, and Rolled Rings.
  • MiG Complex (MC): Production and ROH of Fixed-wing Aircraft and Engines (mainly of Russian origin), Civil MRO, and UAV Projects.
  • Helicopter Complex (HC): Production and ROH of Helicopters (Indian and Western origin).
  • Accessories Complex (AC): Production and ROH of Transport Aircraft. Production and ROH of Accessories and Avionics for Fixed-wing and Rotary wing Platforms (Indian, Russian, and Western origin). Depot Level Maintenance of UAVs.
  • Design Complex (DC): R&D of Fixed-wing and Rotary wing Aircraft, Unmanned Aerial Vehicles (UAV), Aeroengines, Avionics, and Accessories.

Hindustan Aeronautics Ltd (HAL) Company Journey

The history and growth of HAL are synonymous with the development of the Aeronautical industry in India for more than 79 years. Here are some of the critical milestones in the company:

●: 1940:The company was incorporated on 23 Dec 1940 in Bangalore by Walchand Hirachand in association with the then Government of Mysore.

● 1941: In March 1941, the Government of India became a shareholder in the company and took over its management in 1942.

● 1951: In January 1951, Hindustan Aircraft Ltd was placed under the administrative control of the Ministry of Defense, Government of India.

● 1963: In August, Aeronautics India Ltd was incorporated as a Company wholly owned by the Government of India to manufacture MiG-21 aircraft under license. Factories were set up at Nashik (Maharashtra) & Koraput (Odisha).

● 1964: Hindustan Aircraft Ltd and Aeronautics India Ltd merged on October 1, 1964, creating Hindustan Aeronautics Ltd (HAL) as per the amalgamation Oder by the Government of India.

● 1971: The Avionics Design Bureau was established in Hyderabad to develop and manufacture components such as IFF, UHF, HF radios altimeters, and ground radars.

● 1973: A design wing was set up in Lucknow to design and develop accessories such as under-carriage and hydraulic systems, static inverters, fuel control systems, etc.

● 1979: The company began manufacturing ‘Jaguar’ aircraft after obtaining a license agreement with British Aerospace and partnering with Rolls Royce-Turbomeca for Adour engines.

● 1982: The company entered into an agreement with the USSR and started production of swing-wing Mig-27 aircraft at the Nasik Division of the company

● 1983: The Korwa Division of HAL in District Sultanpur (U.P.) was established to manufacture the Inertial Navigation System.

● 2000: An independent profit center was established to offer airport-related services in May.

● 2006: A new MRO Division was created in Bangalore to carry out ALH overhaul activities

● 2018: On 28 March, HAL was listed on BSE and NSE

Performance Creative 2

Build your well-diversified portfolio

Create wealth now!

Build your well-diversified portfolio

Create wealth now!

Hindustan Aeronautics Ltd Management Profile

  • Mr. C.B. Ananthakrishnan is the Chairman, Director (Finance) & CFO, and Managing Director of the company. He is a commerce Graduate with a postgraduate degree in Business Administration from Madras University. He received management and leadership training from the Indian Institute of Management in Ahmedabad and the Institut of Aeronautique et. Spatiale (IAS) in Toulouse, France. He is also a member of the Institute of Cost Accountants of India. He has over 35 years of experience in both public and private sectors. He has worked in various industries, including merchant banking, pharmaceuticals, fertilizers, and aerospace. He joined HAL in 2004.
  • Mr. Jayadeva E. P. is the Director (Operations) of the company. He holds a bachelor’s degree in Electrical Engineering from the University of Visvesvaraya College of Engineering, Bangalore, and did a Master’s from IIT Madras in Aircraft Production Engineering. He joined the company in 1987 as a management trainee and has about 33 years of experience in Manufacturing, Assembly, Overhaul, Upgrades, Customer support, Indigenisation, and other Management functions.
  • Mr. Shailesh Bansal is the Company Secretary and Compliance Officer of the company. He is a fellow member of the Institute of Company Secretaries of India and an Associate Member of the Institute of Cost& Management Accounts of India. He’s also a qualified Chartered Secretary from the Institute of Chartered Secretary and Administrators in the U.K. He has vast experience in both the public and private sectors in managing the overall Corporate Affairs of the companies. He was appointed Company Secretary and Compliance Officer on March 28, 2023. Before this, he worked as a Joint Company Secretary at HAL.
  • Mr. Atasi Baran Pradhan is the company’s Director (Human Resources). He holds a Bachelor’s degree in chemistry (Hons.) and a PG in Personnel Management and labor Welfare from Utkal University, Bhubaneswar. He also holds a Bachelor of Law (LLB) from University Law College, Bhubaneswar. He has 35 years of experience in Human Resources, serving in both Public and private sectors with exposure to various industries such as Engineering, Metallurgy, Paper, Aerospace & Defence across India. He joined HAL in 2005.

Hindustan Aeronautics Shareholding Pattern

image 16
Source: BSE India

Financial Analysis of HAL

HAL posted revenue from operations of INR 26,928 Cr during FY23 compared to INR 24,620 Cr during FY22, an increase of 9.37%. On the profitability front, the company has posted a PAT of INR 5,811 Cr for FY23 as against the PAT of INR 5,087 Cr for FY22, an increase of 14.23%.

If we look at the financial performance over the Financial Year 2019 – 2023, the company has posted a Revenue CAGR of 7.71% and a PAT CAGR of 25.45%, which is relatively good. HAL has consistently delivered operating margins (EBITDA %) in the range of 24.67% to 30.95% since 2019.

image 17
Source: HAL Investor Presentation FY23

ROCE

The ROCE of HAL is 31% in FY23, which is relatively good. HAL has consistently delivered ROCE of 24% over the last five years.

image 18
Source: HAL Annual Report FY23

HAL Fundamental Analysis

  • Hindustan Aeronautics Limited (HAL), a prominent company in India’s defense and aerospace industry, has a robust long-term growth plan supported by a strong order book and promising prospects in the near and long term.
  • During this year, the company secured contracts for producing and supplying 70 Nos. HTT-40 Basic Trainer aircraft and 6 Nos. of Dornier 228 Aircraft, respectively. As of March 31st, 2023, the Company’s Order Book position is INR 81,784 Cr.
  • The HAL-L&T consortium was awarded an INR 860 Cr contract to develop five Polar Satellite Launch Vehicles (PSLV) for New Space India Limited (NSIL) on September 5, 2022.
  • The company continues to develop new platforms, products, and technologies to enhance its capabilities and stay ahead of future technological challenges. These efforts have resulted in major achievements such as successful flights of various aircraft and the development of advanced projects like the LCA Mk II and Indian Multirole Helicopter. This will improve visibility for future platform orders.
  • The company spent INR 2,494 Cr on R&D, 9.46% of the turnover. Additionally, INR 539 Cr (15% of Operating PAT) was transferred to the R&D corpus in FY 2023. HAL supplied four Gas Turbines to power INS Vikrant, India’s first indigenous aircraft carrier, commissioned by the Prime Minister in Kochi.
  • In FY 2022-23, HAL spent INR 2,081.73 Cr on Capital Expenditure (CAPEX) to maintain infrastructure, develop systems/platforms for Defence Forces, and become Atmanirbhar Bharat. Investments were made towards the Green Field Helicopter project, augmentation of LCA facilities, ROH of SU-30, ROH of AL-31 FP Engine, etc.
    Honorable President of India, Smt. Droupadi Murmu inaugurated HAL’s Integrated Cryogenic Engine Manufacturing Facility (ICMF) in Bengaluru on September 27, 2022. The facility will manufacture rocket engines for ISRO.
  • Honorable Prime Minister Narendra Modi dedicated HAL’s new helicopter factory in Tumakuru to the nation on February 6th, 2023, and unveiled HAL’s indigenously designed and developed LUH.
  • The Company produced 22 new aircraft and helicopters annually, including LCA Tejas, Dornier Do228, ALH Dhruv, Light Combat Helicopter (LCH), and Light Utility Helicopter (LUH). In addition, it produced 51 new engines and accessories across its various divisions. The Company also overhauled 216 aircraft/helicopters and 535 engines during the year.

HAL Share Price History

HAL was listed on the Indian Stock Exchange on 28 March 2018 at a price per share of INR 1,130 and currently trades at 3,869.25 per share (as of 17 August 2023). HAL has delivered a stupendous three-year stock price CAGR of 46%. Over the last year, HAL’s share price grew 69 %. HAL’s share price is expected to grow over the long term due to its monopoly in the Aircraft and Helicopter manufacturing and service industry.

image 19
Source: Trading View

HAL -What’s Next?

After the COVID-19 pandemic, the Aerospace and Defense (A&D) industry is recovering in both the civil and defense sectors. The defense sector is expected to grow in 2023-24 due to global geopolitical conflicts, as many countries have significantly increased defense budgets to strengthen their military capabilities.

In the civil sector, global passenger traffic has improved significantly in 2022, and it is expected to reach 2019 levels by the end of 2023 or early 2024. This has become a driving factor for large-scale manufacturing orders and aftersales activities in the industry.

As part of the Atmanirbhar Bharat initiative, the Indian government is supporting the growth of domestic industries to decrease defense imports and reliance on foreign OEMs. This will benefit HAL as India’s sole player in this segment.

The company plans to expand its manufacturing unit, production capability, and geographical reach. It also invests in R&D for innovation, doing partnerships with other companies for future growth, thus creating shareholder value.

The company announced it had a strong order book of `81,78,400 lakh and anticipated significant revenue growth from the existing and upcoming contracts.

ParticularsBalance as of 01.04.2022Fresh orders (During 22-23)Order Liquidated (During 22-23)Outstanding Sanction/supplies
Manufacturing Contracts61,564        25,990        26,36060,470
Repair & Overhaul8,1418,537
Spares11,16211,192
Design & Development Projects 1,1001,345
Exports187241
Total82,15425,99026,36081,784
Source: HAL Annual Investor Presentation FY23

HAL signed an MoU with Safran to establish a joint venture for developing, producing, selling, and supporting helicopter engines. In March 2022, they signed an MoU with IAI (Israel Aerospace Industries) to convert civil passenger aircraft to multi-mission tanker aircraft.

Key risks:

● Fluctuations in the prices of raw materials and delays in the availability of critical components may affect the execution.
● Allowing private companies into the defense sector could increase competition.
● Change in preference of Defence customers by moving from nomination to competitive procurement.
● Little presence outside India in the export market.
● Dependency on foreign OEMs for supply of critical Components and Spares required for the manufacture and overhaul of Aircraft/ Helicopters

FAQs

  1. Is Hindustan Aeronautics Ltd. (HAL) good to buy long-term?

    HAL dominates the Indian market in its business segment. It continuously increases production capabilities, invests in innovation, and launches new platforms, products, and technologies to meet future demands and drive growth. To know if it is a good buy, you must thoroughly analyze the company fundamentals before you decide.

  2. What is the face value of HAL?

    The face value of HAL is INR 10 per share.

  3. What is the Market cap of HAL?

    The market cap of HAL is INR 1,28,338 crores as of 16th Aug 2023.

Read more:  How Long-term investing helps create life-changing wealth – TOI.

No more posts to show

Frequently asked questions

Get answers to the most pertinent questions on your mind now.

An investment advisory firm is a company that helps investors make decisions about buying and selling securities (like stocks) in exchange for a fee. They can advise clients directly or provide advisory reports and other publications about specific securities, such as high growth stock recommendations. Some firms use both methods, like Research & Ranking, India’s leading stock advisory company, specializing in smart investments and long-term stocks since 2015.

An investment advisory firm is a company that helps investors make decisions about buying and selling securities (like stocks) in exchange for a fee. They can advise clients directly or provide advisory reports and other publications about specific securities, such as high growth stock recommendations. Some firms use both methods, like Research & Ranking, India’s leading stock advisory company, specializing in smart investments and long-term stocks since 2015.
What is an Investment Advisory Firm?

An investment advisory firm is a company that helps investors make decisions about buying and selling securities (like stocks) in exchange for a fee. They can advise clients directly or provide advisory reports and other publications about specific securities, such as high growth stock recommendations. Some firms use both methods, like Research & Ranking, India’s leading stock advisory company, specializing in smart investments and long-term stocks since 2015.

An investment advisory firm is a company that helps investors make decisions about buying and selling securities (like stocks) in exchange for a fee. They can advise clients directly or provide advisory reports and other publications about specific securities, such as high growth stock recommendations. Some firms use both methods, like Research & Ranking, India’s leading stock advisory company, specializing in smart investments and long-term stocks since 2015.

An investment advisory firm is a company that helps investors make decisions about buying and selling securities (like stocks) in exchange for a fee. They can advise clients directly or provide advisory reports and other publications about specific securities, such as high growth stock recommendations. Some firms use both methods, like Research & Ranking, India’s leading stock advisory company, specializing in smart investments and long-term stocks since 2015.

An investment advisory firm is a company that helps investors make decisions about buying and selling securities (like stocks) in exchange for a fee. They can advise clients directly or provide advisory reports and other publications about specific securities, such as high growth stock recommendations. Some firms use both methods, like Research & Ranking, India’s leading stock advisory company, specializing in smart investments and long-term stocks since 2015.

Who we are

SEBI registered investment advisory services

Media, Award & Accolades

Stay updated with our winning journey

Video Gallery

Watch our exclusively curated financial videos

Performance

Know the journey of stocks

Newsletters

Stay on top of the stock market

Contact us

Stay in touch

5 in 5 Strategy

A portfolio of 20-25 potential high-return stocks

MPO

1 high-growth stock recommendation/ month, that is trading below its intrinsic value

Combo

A combined solution of 5-in-5 wealth creation strategy & mispriced opportunities

Dhanwaan

Manage your portfolio with dhanwaan

Informed InvestoRR

A step by step guide to sharpen your investing skills

EPW Coming soon

A concentrated portfolio of 12-18 high-growth & emerging theme stocks

Pricing

Choose from our range of pricing packages