1. Home
  2. Blog
  3. Fundamental Analysis of Stocks

Fundamental Analysis of Stocks

Know company background, financials, & more

Introduction Punjab National Bank, popularly known as PNB Bank, became the third bank in the public domain to reach a […]

Introduction

Punjab National Bank, popularly known as PNB Bank, became the third bank in the public domain to reach a market valuation of Rs. 1 lakh crore on 15 December 2023. While the PNB share price was not at an all-time high on Friday, the government’s equity aid to revive the public sector banks from the claws of NPAs helped the bank achieve this milestone.

However, is it just the government’s support, or is the bank also putting effort into becoming one of the largest public sector banks in the country? Let’s find out.

Overview of Punjab National Bank

In 1894, members from different parts of the country established the Punjab National Bank with a vision of offering the citizens a true national bank that would benefit the people and the economy. The first board members included some eminent personnel such as Sardar Dayal Singh Majithia, Kali Prosanna Roy, Lala Harikrishna Lal, and others. On 12 April 1895, the bank started operating, and Lala Lajpat Rai was the first PNB customer to open an account with the bank.

Business Overview: PNB is a full-service bank offering various financial products for different uses. From loans to insurance to deposits, government financial schemes under its banking wing. It offers loans for retail, business, and agricultural needs. It has multiple schemes for MSMEs and SMEs. Apart from personal banking, corporate banking services are available, including cash management services, forex services for exporters and importers, and more. It also offers international banking facilities from foreign exchange and NRI accounts to world travel cards and others. That’s not all; Punjab National Bank has a capital services segment, which offers Mutual Funds, Merchant banking facilities, Depository services, and more.

Key Management Personnel

  • Shri Atul Kumar Goel became the CEO and MD of Punjab National Bank on 1 February 2022. Before joining PNB, he held the same position at UCO Bank. He is a qualified CA and has a rich professional banking experience of more than 30 years. His expertise revolves around more or less all the banking segments, including handling large corporates, risk management, treasury management, financial planning, and investor relations.
  • Atul Kumar Goel played a pivotal role in bringing UCO Bank to life when it was on the verge of sinking with five years of consecutive losses. In FY 2020-21, when he was the MD and CEO of UCO bank, he brought the profitability back to the bank. Apart from being in the banking industry, he also held the position of Director of New India Assurance Co. Ltd. There are several similar positions he either held in the past or still holds. Shri K G Ananthakrishnan acts as the Non-official Director and Non-Executive.
  • Chairman of PNB. With over 40 years of experience in progressive leadership, he joined PNB as the Non-executive Chairman on 7 November 2022. He is known for his strategic thinking, thought leadership, and ability to build high-performing organizations. His expertise lies in general management, partnership building, strategic planning, optimization of profits and revenue, policy development, marketing tactics, and more. He started his career in 1976 as an executive in the sales and marketing team at Novartis India Ltd, and after that, his journey with the pharmaceutical industry began in 1999.
  • Shri Kalyan Kumar, an Executive Director of Punjab National Bank, started this journey in October 2021. He has over 25 years of experience in the banking sector, and he started as a Rural Development Officer at Union Bank in 1995. He is known for his strategies for different training programs for public sector banks, unique leadership development, and employ-centric operations.

PNB Shareholding Pattern

As of 30 September 2023, the shareholding pattern of PNB was segregated into promoters and the public only. The total number of fully paid equity shares outstanding as of the said date was over 1101 crores.

image 7
Source: BSE

Financials of PNB

  • Total Income: The total income of PNB grew over the years. Between FY19 and FY23, the total income has grown at a CAGR of 10.73%, from Rs. 59514.53 crore to Rs. 99084.88 crore. In the FY24’s second quarter, the total income stood at Rs. 29847.05 crores.
Source: BSE
image 8
Source: BSE
  • Net Profit: Coming to The net Profit of this public sector bank, was negative during FY19 and FY20, from which it grew Rs. 5886.99 crores in FY23. During the Q1 and Q2 of FY24, the net profits stood at Rs. 1210.82 crores and Rs. 1764.54 crores, respectively.
Source: BSE
image 9
 Source: BSE

Key Financial Ratios of PNB

  • Return on Equity: Investors who purchased PNB shares before FY21 had earned an ROE of around 3.88% in FY21, which increased to 5.96% in FY22; however, in FY23, the ROE fell as per the PNB bank share price movement.
image 10
Source: BSE
  • Global Net Interest Margin Ratio: For any bank, the Net Interest Margin is a crucial metric to analyze its growth over the years. In FY21, the ratio stood at 2.88%, which declined to 2.71% in FY22, but in FY23, it rose to 3.06%.
image 11
Source: BSE
  • Return on Asset: Investors who had PNB shares in FY22 gained higher than those who sold the PNB share before the said year or invested later as in FY22, the ROA of the bank rose to 0.26%, while in FY21, it was 0.15% and in FY23, it stood at 0.18%.
image 12
Source: BSE
  • Net NPA: Punjab National Bank has reduced its NPA over the years. If you look at the Net NPA Ratio in FY21, it stood at 5.73% while it decreased to 2.72% in FY23.
image 13
Source: BSE

PNB Share Price History

image 14
Source: BSE

The Punjab National Bank share price has surged close to 65% in the past year, between 20 December 2022 and 19 December 2023. In the past year, the share price almost went up gradually, with minor corrections in between.

If you look back to 2002, the PNB Share price was around Rs. 72.9, which rose to almost Rs. 1221 in 2010, but then in 2020, it dropped to 33.05, which has been the lowest in these 21 years that is from FY2022 to FY2023.

image 15
Source: BSE

PNB SWOT Analysis

From the financial information and ratios and PNB share price analysis, it can be understood that this public sector bank is again returning to business. After its share price touched the floor in 2020, in just three years, that is, on 15 December 2023, the bank ranked third as per market valuation amongst all public sector banks, a major achievement.

On the other hand, while the profits turned negative during 2019-2020, they turned positive and grew for the past three years between FY21 and FY23. Similarly, the return on equity has increased over the years as well.

Competitive Advantage

  • The third largest bank in the public sector as per market valuation.
  • The government of India is the largest shareholder of PNB. As of 30 June 2023, GOI had 73.15% stakes in this bank.
  • Offering basic banking products as well as high-end fintech services
  • Net NPAs have reduced to 2.72% in FY23, which suggests improvement in the financial health of the bank
  • Strong and experienced management team
  • PNB has a well-developed deposit base which increased by 14.18% on a YoY basis in Q1FY24.
  • As of 31 March 2023, PNB’s network had 10080 branches nationwide.

Risks

While PNB’s share price is reviving, the profits are going up, but still, certain challenges remain which can be a hindrance to the growth of this PSU bank.

  • The macro-economic situation, such as recession fear in the West, can lead to borrower’s credit servicing ability.
  • The bank’s ability to generate return on its assets has dipped drastically in FY23, which can be a concern regarding its management’s efficiency.

FAQs

  1. What does PNB do?

    PNB is a full-service public sector bank which offers different financial and banking products and services such as loans, deposits, insurance products, and capital market products and services.

  2. When PNB was established?

    Punjab National Bank was established in May 1894 and started its operations in April 1895.

  3. How has PNB’s share price performed?

    In the past year, from 20 December 2022 to 19 December 2023, the PNB Share Price has increased by 64.61%.

Several brands have ingrained themselves so deeply in our lives that they have become nearly irreplaceable or synonymous with their […]

Several brands have ingrained themselves so deeply in our lives that they have become nearly irreplaceable or synonymous with their product category. One such brand is Good Knight, a mosquito repellent from the house of Godrej Consumer Products. Several other products from the same company, such as Cinthol, Hit, Aer, Godrej expert hair color creme, etc., have high brand recall among customers.

In this article, we will understand more about Godrej Consumer Products and Godrej Consumer share price.

Brief Overview of Godrej Consumer Products

The Godrej brand needs no introduction in India and has over 125 years of rich history. The roots of the company date back to 1897, when Ardeshir Godrej, the company’s founder, became successful in the locks business after a few failed ventures. In the following years, Godrej ventured into multiple product categories, and in 1918, it launched the world’s first vegetable oil soap, Chavi.

Over the years, Godrej emerged as a diversified conglomerate interested in food, chemicals, agriculture, FMCG, real estate, etc.

Godrej Consumer Products Limited (GCPL) was created in 2001 through the demerger of Godrej Soaps Limited. The company was demerged into a chemical business- Godrej Chemicals, and a focused FMCG business, Godrej Consumer Products. Today, GCPL is a global company with over 85 countries and a revenue of $1.6 billion in FY23. The company has a strong presence in Indonesia, Sub-Saharan Africa, the USA, and Latin America.

Business Overview of Godrej Consumer Products

GCPL has divided its business into two categories:

  • Home Care
  • Personal Care

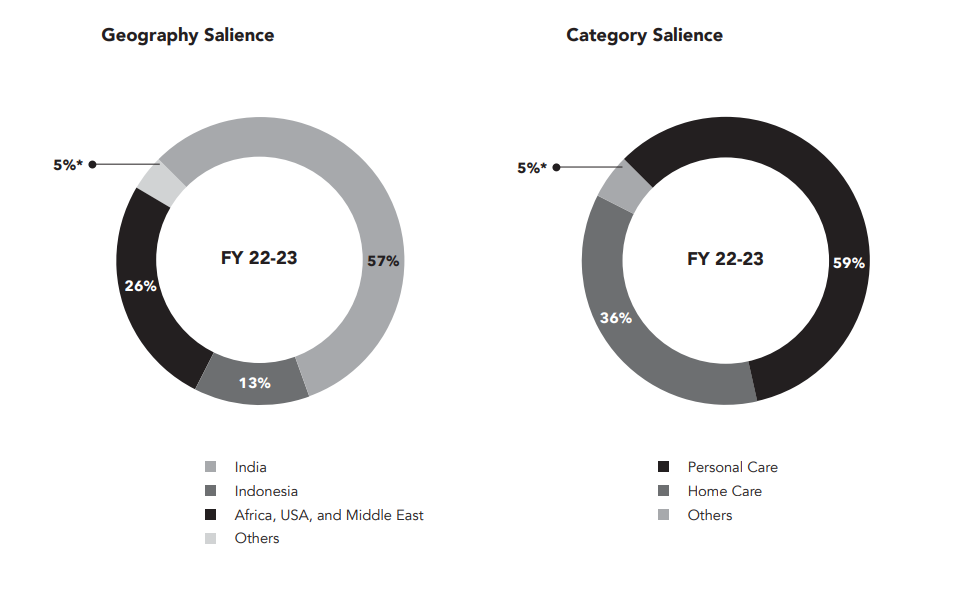
The home care category includes household insecticides, air care, fabric care, and home hygiene. The personal care category includes personal washing and hygiene, hair care, and premium beauty and professional products. As reported in the AS 108 by the company, it has identified geographical segments as reportable segments, which are as follows:

  • India
  • Indonesia
  • Africa
  • Others

The company’s top brands include Good Knight, Cinthol, Godrej No. 1, Darling, Hit, Godrej Expert, Stella, Ezee, Mitu baby wipes, and Godrej Aer. These 11 brands have contributed around 75% of revenue in FY23.

Key Management Personnel

  • Ms. Nisaba Godrej is the Executive Chairperson of GCPL and has been a key architect of the company’s strategy and transformation in the last decade. She has a BSc degree from The Wharton School at the University of Pennsylvania and an MBA from Harvard Business School.
  • Mr. Sudhir Sitapati is the Managing Director and CEO of GCPL and joined the company in October 2021. He was with HUL as Executive Director- Foods and Refreshments and has been with the company for 22 years. Mr. Sudhir has an MBA from IIM-Ahmedabad and a B.Sc in Maths with Economics from St. Xavier’s College, Mumbai.
  • Mr. Aasif Malbari is the Chief Financial Officer at GCPL and joined recently in August 2023. Earlier, he was CFO at Tata Passenger Electric Mobility Limited and Director at Tata Motors Passenger Vehicle Limited. He is a qualified Chartered Accountant and Company Secretary.
  • Mr. Sumit Mitra is the Head of Human Resources at GCPL and group companies. He joined the company as a management trainee and has spent over 25 years working across different business verticals of the group.

Godrej Consumer Product Shareholding Pattern

image 37
Source: BSE India

Godrej Consumer Product Financials

Revenue

In FY23, GCPL reported a 9% year-on-year increase in total revenue to ₹13,484.38 crores from ₹12,366.21 crores. In Q2FY24, the company reported a 6.9% increase in revenue to ₹3.667.88 crores from ₹3,431.79 crores in Q2FY23.

image 38

Segment-wise Revenue

Net Profit

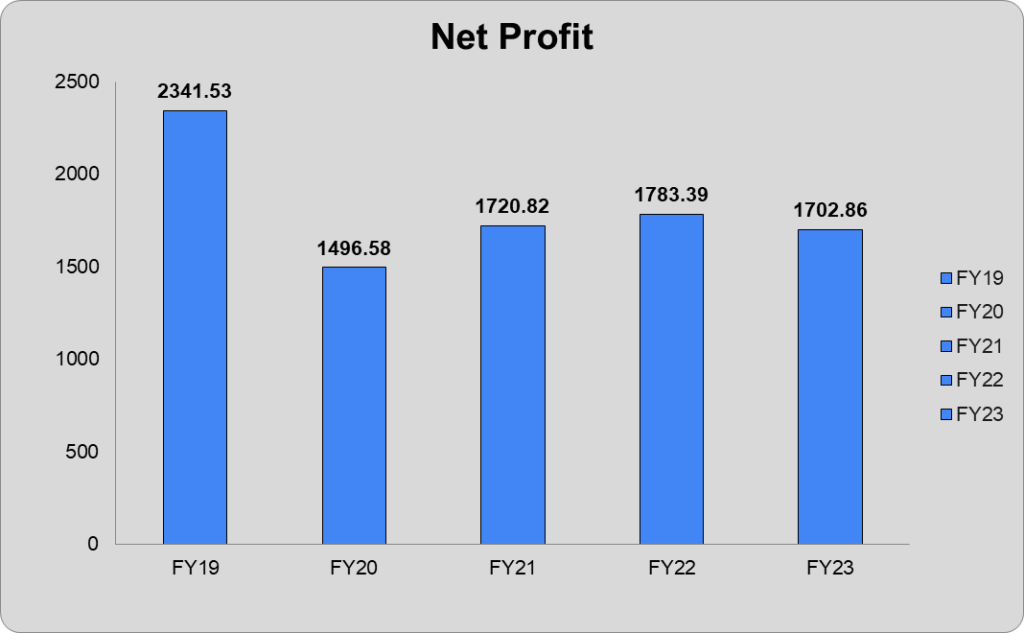
In FY23, the company reported a 4.5% fall in net profit to ₹1,702.86 crores from ₹1,783.39 crores in FY22. In Q2FY24, the company’s net profit increased 20.6% to ₹432.77 crores from ₹358.66 crores during the same period the previous year.

image 39

Key Financial Ratios

Current Ratio: On 31st March 2023, the company’s current ratio increased by 16% to 1.76 times from 1.43 at the end of 31st March 2022.

Inventory Turnover Ratio: The inventory turnover ratio during FY23 increased by 19% to 7.20 times from 6.33 in FY22.

Trade Receivable Turnover Ratio: The company’s trade receivable turnover ratio declined marginally by 2% to 22.90 times in FY23 from 23.34 at the end of FY22.

Trade Payables Turnover Ratio: At the end of FY23, the company’s trade payables turnover ratio increased by 8% to 5.28 times, from 4.87 at the end of FY22.

Net Profit Margin: The company’s net profit ratio during FY23 was 12.9%, down from 14.65% during FY22.

Return On Capital Employed (ROCE): The ROCE of the company declined by 18% during FY23 to 14.9% from 18.1% in FY22.

Debt To Equity Ratio: The company has no significant debt. Therefore, the debt-to-equity ratio is zero, and the debt-service coverage ratio is almost 100%.

Godrej Consumer Share Price History

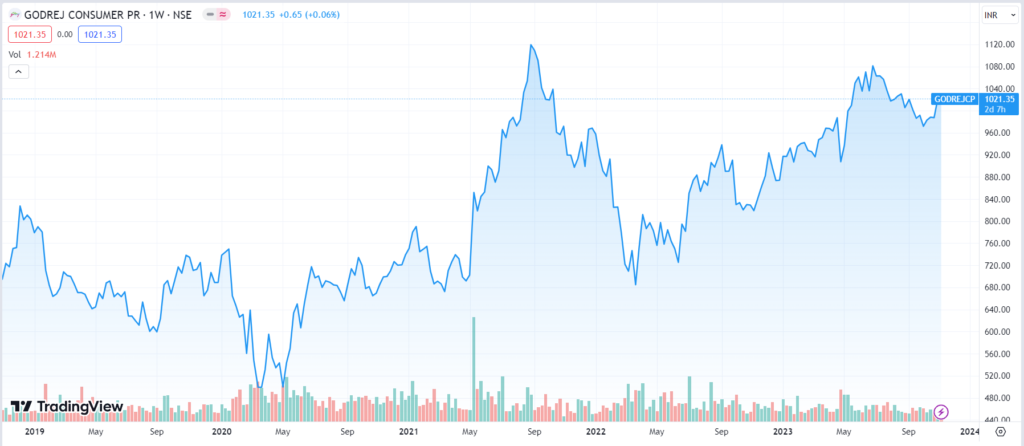
Godrej Consumer Products Limited was listed in the stock market through way of a demerger in 2001 and has been a consistent performer. As of 6th November 2023, the stock of GCPL has given a CAGR return of 15% and 8% over the last three and five years, respectively.

godrej
Source: TradingView

Godrej Consumer Products has done two bonus issues and split its shares once. 100 shares of GCPL issued in 2001 are now 1200 shares.

The company paid ₹6 in 2019, ₹2 in 2020, and ₹5 in 2023 as dividends to its shareholders. Godrej Consumer Products share price has hit an all-time high level of ₹1119 on 3rd September 2021. As of 6th November 2023, the market cap of Godrej Consumer Products Limited is ₹1,04,823 crores.

Peer Comparison

Acquisition of Raymond Consumer Care Limited

In April 2023, the management of Godrej Consumer Products announced the acquisition of Raymond’s FMCG business, which houses brands like Park Avenue, KS, Kamasutra, and Premium. With this acquisition, the company aims to strengthen its product portfolio beyond soaps and insecticides. It will help GCPL to operate in the highly competitive deodorant market, where HUL, ITC, and other small players are active.

In FY23, Raymond’s FMCG business reported a revenue of ₹622 crores, and the deal was closed at 4.5 times the revenue, i.e., ₹2,825 crores. With this acquisition, Godrej wants to repeat the success of the acquisition of Transelektra in 1994, which made the GoodKnight and Hit brands. Godrej acquired the brand for ₹100 crores, now with an implied value of ₹30,000 crores.

Key Highlights

The company’s three big markets are India, Indonesia, and Africa, and it has employed distinct product strategies for each region that helped it to become a leader in their respective product category.

  • India & SAARC countries: The company is the leader in household insecticides, air care, and hair color. It stands second in the market share for fabric care, personal wash, and hygiene products.
  • Indonesia: Godrej is the market leader in household insecticides, air care, and baby wipes in the country and is in third position in the hair color segment.
  • Sub-Saharan Africa & USA: In these regions, GCPL is the market leader in the hair color segment, with the second spot in premium beauty and professional products.
  • Latin America: The company is the leader in hair color premium beauty and professional products in Latin American countries.
GCPL
  • In Q2FY24, the company’s consolidated EBITDA margin was 19.7%, with the company’s India business leading the growth. During the quarter, the company reported a 980 bps year-on-year expansion in gross profit margin. GCPL has taken multiple strategic cost reduction initiatives expected to enhance the EBITDA level in the coming quarters.
  • The company’s revenue from the e-commerce segment witnessed 33% CAGR growth in the last two years and is currently renewing its focus on the quick commerce segment. Also, with a strong e-commerce focus in the US, accounting for 6% of the e-commerce business.
  • The sharp improvement in newly acquired Raymond’s FMCG business performance, with sales clocking at ₹142 crores in Q2FY24. Integration of the brands is completed with GCPL, and cost synergies may flow from H2FY24.

Brief Industry Overview

  • The creme segment dominates the global hair color market and may grow from $23.6 billion in 2022 to $35.2 billion by 2028, with an estimated CAGR growth of 6.2%. Regarding demand, Asia-Pacific accounted for the most significant global market share in 2021.
  • Increased demand from the aging population will likely boost hair color market growth. The overall increase in population in China and India and the aging population in Japan and South Asian countries are generating a high demand for hair color.
  • As per estimates, the global household insecticide market has witnessed sales of $15.12 billion and is expected to double to $31.67 billion by 2033, with an estimated CAGR growth of 7%.
  • Urbanization and changing lifestyles, increased demand for natural & eco-friendly household insecticides, convenience and ease of use, raising awareness about health and hygiene, and rising consumer disposable income are currently driving the market growth.
  • The deodorant market is one of the high-growth markets in India and is valued at $1.35 billion in 2023. It is estimated that through 2029, the market size may grow at a CAGR of 11.3%.

FAQs

  1. When was Godrej Consumer Products Limited established?

    Godrej Consumer Products Limited was established as a legal entity in April 2001 and was demerged from Godrej Soaps Limited, with headquarters in Mumbai. The company entirely focuses on the FMCG vertical.

  2. How has Godrej Consumer Products share price performed in the last five years?

    As of 6th November 2023, Godrej Consumer share price has given a CAGR return of 8% in the last five years. Godrej Consumer share price has hit an all-time high of ₹1119 on 3rd September 2021.

  3. What are the consumer products of Godrej Consumer Products Limited?

    Godrej Consumer Products Limited houses brands like Good Knight, Hit, Aer, Ezee, etc. The company has a strong presence in Indonesia, the Saharan sub-Africa, the USA, and Latin America.

Bank of Baroda’s history is steeped in excellence as one of India’s foremost public sector banks. With a robust legacy, […]

Bank of Baroda’s history is steeped in excellence as one of India’s foremost public sector banks. With a robust legacy, it holds a formidable position in the banking industry, delivering diverse banking products and services to individuals, corporations, and governments globally.

Bank of Baroda History

Bank of Baroda has evolved significantly from its inception to become India’s third-largest public sector bank (PSU).

1908

  • Maharaja Sayajirao Gaekwad III, the Maharaja of Baroda, founded the Bank of Baroda on 20 July 1908.
  • The first branch was set up at Mandvi, Baroda (now known as Vadodara).

1918 – 1949

  • Over the years, branches were set up at key locations like Bombay (now Mumbai), Calcutta (now Kolkata), Delhi, and more.
  • 1953: The bank established its first overseas branches in Mobasa (Kenya) and Kampala (Uganda).
  • 1957: It set up operations in the United Kingdom (UK).
  • 1964: It became the first bank to start mobile operations.
  • 1969: The bank was nationalized. “The Bank of Baroda Ltd” became “Bank of Baroda”.
  • 1985: The bank began to computerize and mechanize its operations. It also introduced BOBCARD.
  • 1996: It became one of the first nationalized banks to tap into the capital market via the public issue of equity shares.

2007 – 2008

  • The bank has completed 100 years since its inception.
  • It set up India’s first Gen-Next branch dedicated to the youth.
  • The bank established a joint venture for mutual funds, “Baroda Pioneer Asset Management Company Ltd.” with Pioneer Investments of Italy.
  • Bank of Baroda introduced state-of-the-art banking technology solutions with “BarodaNext”.
  • There was 100% implementation of core banking solutions.
  • 2019: The country witnessed the first-ever tripartite amalgamation of Bank of Baroda, Vijaya Bank, and Dena Bank.
  • 2020: The bank introduced a transformation project, “BOB NOWW,” to build a futuristic bank.
  • 2021: The bank launched BoB World, an end-to-end video KYC-based online account opening process, and a website centralization project
  • 2022: It won the ‘Best Technology Bank’ by the Indian Banks’ Association (IBA) two times in a row. The Great Place To Work Institute certified it as a Great Place To Work.
  • 2023
  • Bank of Baroda emerged as the Overall Top Performing Bank in the EASE 4.0 Reforms Index FY2021-22.
  • Fabulous Employers Pvt Ltd certified it as a Great Place to Work.
  • It received the Best AI and ML Bank among large banks at the IBA.
  • It was felicitated at The Economic Times “Best BFSI Brands 2023”.

The bank is revamping its business model by including Environmental, Social, and Governance (ESG) elements. This will help reduce the bank’s carbon footprint and improve its ESG ratings.

Bank of Baroda Business Overview

Bank of Baroda is amongst the leading public sector banks in India. Post the merger of Bank of Baroda with Vijaya Bank and Dena Bank in 2019, it became India’s third-largest public sector bank.

The bank offers a wide range of solutions and services. These include personal banking, corporate banking, international banking, small and medium enterprise (SME) banking, rural banking, non-resident Indian (NRI) banking, and treasury services.

Bank of Baroda Management Profile

Dr. Hasmukh Adhia

He is the Non-Executive Chairman of the Bank of Baroda. Dr. Adhia holds a Post-Graduate degree in Accountancy. Additionally, he is a Gold medalist from the Indian Institute of Management (IIM), Bangalore. He has held important positions in the Government of India. He has also served on the Board of Directors of various institutions/companies.

Shri Debadatta Chand

He is the Managing Director and CEO of Bank of Baroda. He has over 29 years of experience in the banking and financial services industry. Shri Debadatta Chand holds a B. Tech. Degree, an MBA degree, a CAIIB qualification, and a PG Diploma in Equity Research. He is also a certified Portfolio Manager.

Shri Ajay K Khurana

Shri Khurana is an Executive Director at Bank of Baroda. He holds a Post-Graduate degree in Business Management and a CAIIB qualification.  He has over 17 years experience in various capacities.

Shri Joydeep Dutta Roy

He is an Executive Director at the Bank of Baroda. Joydeep Dutta Roy has over 25 years of banking experience. He holds an Honours degree in Economics from Delhi University. He is also a law graduate with an MBA from the Narsee Monjee Institute of Management Studies, Mumbai.

Shri Lalit Tyagi

Shru Tyagi is an Executive Director at the Bank of Baroda. He has over 26 years of experience in various spectrums of banking. He is also a law graduate with an MBA from the Narsee Monjee Institute of Management Studies, Mumbai.

Bank of Baroda Shareholding Pattern

image 30

Let us have a detailed look into the shareholding pattern of the Bank of Baroda.   

image 31
  • For the quarter ended June 2023, the bank’s total promoters’ stake remained unchanged at 63.97%.  
  • The FII holdings increased from 4.57% in March 2020 to 12.29% in June 2023.
  • Furthermore, DIIs have increased their share in this stock from 13.95% in March 2020 to 17% in June 2023.
  • Though the public holding stood at 9.88% in March 2020 and 13.24% in March 2021, it decreased to 7.71% in June 2023.    

Bank of Baroda Financials

1. Core Operating Profit and Net Profit

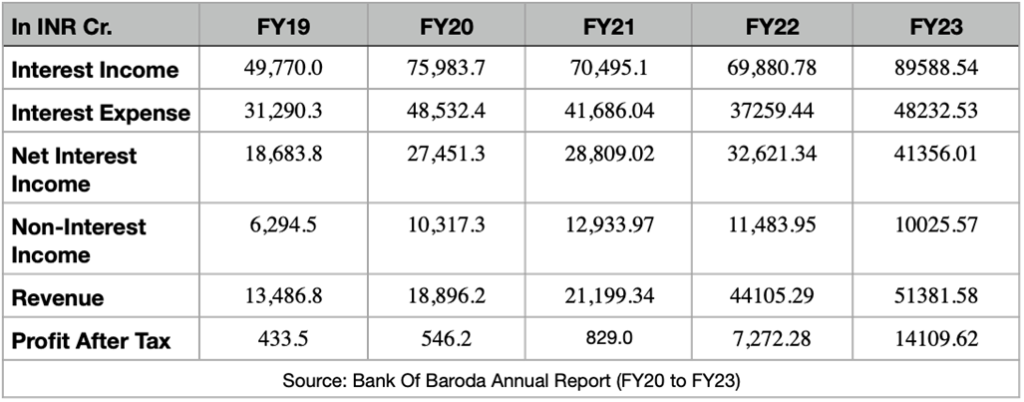
The bank has reported an operating income of ₹51,381.58 crore during FY2022-23, compared to ₹44,105.29 crore during FY2021-2022. The bank has posted a net profit of ₹14,109.62 crore (nearly double) for FY2022-23, as against a net profit of ₹7,272.28 crore for FY2021-22.      

image 23

2. Net Interest Income and Net Interest Margin

Net Interest Income (NII) is the difference between the interest earned on a bank’s assets (like loans and investments) and the interest paid on its liabilities (like deposits and borrowings).

Net Interest Margin (NIM) is calculated by dividing the NII by the average interest-earning assets.

The bank’s Net Interest Income increased to ₹41,356 crore in FY2022-23 from ₹32,621 crore in FY2021-22, registering a growth of 26.8% YoY. The NII for the quarter of 30 June 2023, at ₹10,997 crore, grew by 24.4% YoY.  NIM global and NIM domestic improved to 3.31% and 3.42% in FY2022-23 as against 3.03% and 3.09%, respectively, in FY2021-22.   

image 24

3. Asset Quality (GNPA & NNPA)

NPA refers to Non-Performing Assets. It is a loan or an advance where the borrower has not paid the interest or principal amount for a specified period, generally 90 days or more.

Gross NPA is the total value of a bank’s NPAs. Net NPA is the value of NPA after reducing the provisions made by the bank to cover the potential losses arising from the NPAs.

FY2022-23 saw a significant improvement in the bank’s asset quality. Higher recoveries and upgradations drove the improvement.  In FY2022-23, the Gross NPA (GNPA) ratio declined by 282 bps to 3.79% in FY2022-23 and Net NPAs dropped to an 11-year low of 0.89%. 

Fresh slippages were lower during the year, which led to a fall in the slippage ratio to 1.07%, with credit costs coming in at a record low of 0.53%.   

The Provision Coverage Ratio (PCR), including Technical Written Off (TWO) accounts, could help the bank prepare to cover future losses. It has risen to 92.43%, indicating a significant protection level. The bank has constructed efficient collection machinery using advanced analytical tools to detect potential weaknesses and early warning signs.

The BOB balance sheet indicates the provisions for NPA have declined to ₹4,351 crore in FY2022-23 from ₹14,640 crore in FY2021-22. The bank launched the One-Time Settlement (OTS) schemes “Rin Mukti Yojana” and “Vasooli Sankalp” to address a large number of small NPA accounts.     

image 25

4. Advances and Deposits

An advance is a loan or credit offered by banks to their customers. Banks offer various advances such as business, personal, home, education, vehicle, and credit card loans. Advances as of 30 June 2023 were ₹9,90,988 crore as against ₹8,39,785 crore on 30 June 2022, an increase of 18% YoY.      

Deposits are a critical source of funding for banks, and they use these funds to provide loans and advances to customers. As of 30 June 2023, deposits were ₹11,99,908 crore as against ₹10,32,714 crore on 30 June 2022, an increase of 16.2% YoY.  The total deposits rose to ₹12,03,688 crore during FY2022-23 from ₹10,45,939 crore during FY2021-22, registering a 15.1% YoY growth.     

The bank’s net advance increased to ₹9,40,998 crore during FY2022-23 from ₹7,77,155 crore during FY2021-22, registering a growth of 21.1%.     

image 26

The bank’s CASA (Current Account & Savings Account) deposits ratio is 40.33% as of Q1 FY2023-24 and has reduced slightly from 44.18% in Q1 FY2022-23.   

The bank has continued to focus on CASA deposits, with current deposits growing at 9.2% and saving deposits at 7.6%. The CASA ratio stood at 42.25% on 31 March 2023. It will help minimize the overall cost of deposits and manage liquidity.

image 27

5. Return Ratios (ROA and ROE)

The bank’s Return on Assets (ROA) for FY2022-23 improved by 43 bps to 1.03% in FY2022-23 from 0.6% in FY2021-22. It further increased to 1.11% in Q1 FY2023-24.  

The bank’s Return on Equity (ROE) increased by 648 bps to 18.34% in FY2022-23. Q1 FY2023-24 saw an increase in ROE to 20.03%.  

 The book value per share increased to ₹148.80 in FY2022-23 from ₹118.97 in FY2021-22. The earnings per share (EPS) increased to ₹27.28 in FY2022-23 from ₹14.06 in FY2021-22.      

image 28

6. Dividend payouts

Bank of Baroda paid a dividend of 275% for the year ended March 2023. The dividend payout per share of the bank was ₹5.5. In July 2022, the bank paid a dividend of ₹2.85 per share.  In 2015, after the stock split, the bank distributed a dividend of ₹3.20 per share.

Bank of Baroda Share Price History  

image 32
Source: TradingView

The bank’s stock price has been volatile since being listed on the National Stock Exchange in 1991. The stock began trading at a low price and rose to a high of ₹202 in October 2010. However, the stock price took a hit because of the global financial crisis in 2009. As time passed, most public sector banks’ stock prices fell further as their NPAs increased.

Furthermore, the bank opted for a stock split in 2014 — the face value of the share was split from ₹10 to ₹2, which helped increase the overall liquidity for the bank. However, the bank’s stocks have rallied after the successful merger in 2019 with Vijaya Bank and Dena Bank.

The bank’s share price is trading from ₹200 to ₹213. This is due to an increase in Bank of Baroda’s profit (net) this quarter, a significant reduction in NPAs, and an increase in revenue. As of 14 September 2023, the bank’s 52-week high is ₹213.20.

Bank of Baroda SWOT  

Strengths for Bank of Baroda

  • Wide network: Bank of Baroda has 8,205 domestic branches (2,867 in rural India), 93 overseas branches across 17 countries, and 9,764 ATMs.
  • Humongous product portfolio: The bank has a wide range of banking products and services to cater to its diverse customer base. The bank has leveraged technology to cross-sell and create opportunities to generate revenue. 
  • Large customer base: Bank of Baroda has a vast customer base of 15.3 crore. The bank’s Bob World app has around 3 crore activated users.
  • Bank size and government ownership:  The Government of India owns most of the equity stake in BoB (63.97% as of 30 June 2023). As of 31 March 2023, BoB became the second-largest PSB in India in terms of advances, with a 7% market share and a 6.7% share in the total deposits.    
  • Strong capital position: As of 31 March 2023, the bank has a robust capital adequacy ratio (CAR) of 16.24%.  
  • Strong solvency profile: With the enhanced capital position and the diminishing net non-performing advances (NNPA) level, the bank’s solvency level stands at 10.5% as of 31 March 2023, in contrast to 19.1% as of 31 March 2022. There is an expectation that the bank’s solvency profile will improve in the coming years.  
  • Strong earnings: The bank’s earnings have improved greatly due to the astute management and control of its assets, liabilities, and expenses. There has been an improvement in the core operating profitability (before divestments and trading income) to 2.05% of average total assets (ATA) in Q1 FY2023-24 (1.97% in FY2022-23, 1.70% in FY2021-22).  

Key Risks

  • International market presence: The bank is in 17 countries; however, the primary focus is on the Indian market. To increase profitability, the bank needs to increase its international presence.
  • Brand image: Government banks spend less on their brand image, which can hamper their brand value. The bank must focus on its brand image and be at par with its competitors.
  • Competition: The banking industry comprises domestic (private banks, NBFCs) and foreign competitors. This can also affect the bank’s lending business and other revenue streams.

FAQs

  1. What is the face value of Bank of Baroda’s share?

    The face value of Bank of Baroda’s share price is ₹2 per share.

  2. What is the 52-week high and low of Bank of Baroda?

    As of 8 September 2023, the 52-week high of Bank of Baroda is ₹210.80, and the 52-week low of Bank of Baroda is ₹124.

  3. Who is the promoter of the Bank of Baroda?

    Bank of Baroda is a state-owned bank, and the Government of India holds 63.97% of the total paid-up equity of the bank.

Did you know Colgate originally sold soap and perfume before adding toothpaste to their product portfolio? The company’s roots date […]

Did you know Colgate originally sold soap and perfume before adding toothpaste to their product portfolio? The company’s roots date well before India’s first war of Independence in 1857.

Colgate is more than a company in India; it’s an emotion. The brand has extremely high recall across all age groups and has become synonymous with toothpaste. It’s one of those few companies that have stood the test of time and have grown by leaps and bounds.

In this article, we will understand more about Colgate and Colgate share price. Let’s dive in.

Brief Overview of Colgate

Colgate-Palmolive, as the company is known, was set up by William Colgate in 1806 in New York City. The company was initially called William Colgate & Company and was a soap and candle company.

The company developed and marketed more products over the years, but it is best known for its toothpaste, which it introduced in 1873. Initially, the company sold toothpaste in a jar, and in 1896, it introduced the collapsible tube to sell toothpaste called Colgate Ribbon Dental Cream.

Since then, Colgate has continued introducing a new range of toothpaste, establishing itself as a leading global oral care company serving hundreds of millions of consumers worldwide. In 1928, Palmolive-Peet bought Colgate to create the Colgate-Palmolive-Peet Company, and later, in 1953, Peet was dropped from the title and continued to be known as Colgate-Palmolive Company.

India Entry

Colgate started its operation in India in 1937 with the launch of dental cream. Over the years, it launched its other product range, including shampoo and cold cream, but continued to be known as an oral care company.

Currently, all oral care products are marketed under the Colgate brand, and all other non-oral personal care products, such as hand wash and shaving cream, are marketed under the Palmolive brand.

Business Overview of Colgate-Palmolive

Colgate Palmolive India is a subsidiary of Colgate-Palmolive, a global FMCG company that produces and distributes household, personal care, healthcare, and veterinary products.

In India, Colgate-Palmolive operates only in one segment- Oral, Personal, and Home Care. The oral segment includes toothpaste, toothbrush, mouthwash, toothpowder, and oil-pulling products. In the personal and home care segment, it includes soaps, shampoos, handwash, shower gels, conditioners, shaving products, dishwashing products, house cleaning, etc.

The company has a strong distribution network with a presence in more than 5 lakh villages across India and has three manufacturing units in Goa, Himachal Pradesh, and Gujarat.

Leadership Team

  • Ms. Prabha Narasimhan is the Managing Director and CEO of Colgate-Palmolive India and joined the company in 2022 from Hindustan Unilever Limited, where she led the home care category. She has over 25 years of experience in customer development, consumer marketing, and innovation across geographies and multiple categories in the FMCG segment. Ms. Prabha has graduated from IIM-B and Melbourne Business School.
  • Mr. M.S. Jacob has been the Whole-time Director and Chief Financial Officer since 2016. He joined Colgate in 1995 and served through multiple leadership roles in Finance across the Southeast Divisions of the company as well as the Asia Pacific Divisions. Mr. Jacob holds a B.Com degree from Mumbai University and is a qualified chartered accountant.
  • Mr. Gunjit Jain is the Executive Vice President of Marketing and has been with the company since 2008. He has held roles and responsibilities across customer development, marketing, innovation, strategy, and leadership functions. Mr. Jain holds an MBA from IIFT, Delhi, and a B.Tech from Vellore Institute of Technology.
  • Mr. Balaji Sreenivasan has been the Executive Vice President of Human Resources since November 2020 and joined the company in 2005. He has served through multiple leadership roles in the Human Resources function at Colgate’s subsidiaries in India, Turkey, Central Asia, North Africa, Middle Eastern countries, and the Asia Pacific region.

Shareholding Pattern

image 141
Source: Colgate

Financials

Revenue

In FY23, Colgate-Palmolive reported a 2.4% increase in revenue to ₹5,188 crore compared to ₹5,066 crore in FY22. And, in Q1FY24, the net sales of the company increased by 10.8% over the same quarter last year to ₹1,314.7 crore from ₹1,186.6 crores in Q1FY23.

image 142
Source: Colgate Q1 Results

EBITDA

In FY23, the company reported a marginal dip of 1.2% annually in EBITDA to ₹1,547 crores from ₹1,566 crores in FY22.

image 143
Source: Colgate Q1 Results

Profit After Tax

In FY23, the net profit declined by 2.8% to ₹1,047.15 crores, compared to ₹1,078.32 crores in FY22. And, in Q1FY24, the company reported a net profit of ₹273.3 crore, a growth of 30.5% as against the net profit of ₹209.7 crores in the same quarter the previous year.

image 144
Source: Colgate Q1 Results

Key Financial Ratios

Current Ratio: At the end of FY23, the current ratio of the company improved by 4% to 1.43 times from 1.37 times at the end of FY22.

Debt-to-equity Ratio: The company has no long-term debt on its book. The debt-to-equity ratio as of 31st March 2023 stands at 0.04 times compared to 0.05 at the end of 31st March 2022.

Interest Coverage Ratio: The interest service coverage ratio of the company at the end of FY23 was 281.82 times compared to 236.30 times at the end of FY22.

Inventory Turnover Ratio: The company’s inventory turnover ratio improved by 8% to 5.18 times on 31st March 2023, compared to 4.81 times on 31st March 2022.

Operating Profit Margin: The operating profit margin of the company in FY23 was 26%, compared to 27% in FY22.

Net Profit Margin: The net profit margin of the company in FY23 was 20%, compared to 21% in FY22.

Return on Capital Employed (ROCE): The ROCE of the company at the end of 31st March 2023 increased to 84% from 82% at the end of 31st March 2022.

Colgate Share Price Analysis

Screenshot 1
Source: TradingView

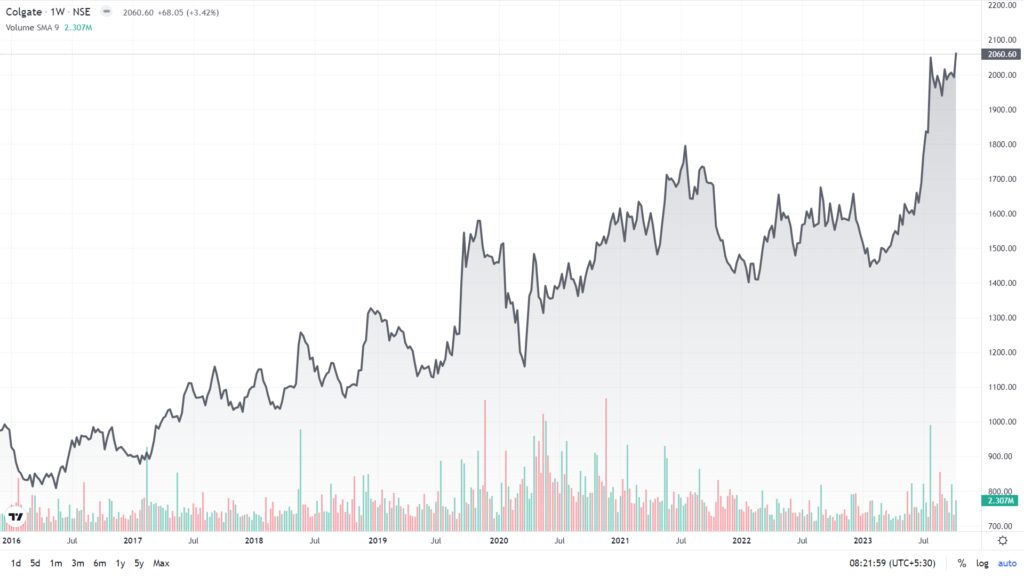
Colgate has consistently generated compounded wealth for its shareholders over time and has shown the least volatility compared to other stocks in the category. The company has issued bonus shares in the past years and has a consistent track record of paying dividends to its shareholders. It paid dividends of ₹39 in 2021, ₹39 in 2022, and ₹21 in 2023 to its shareholders.

As of 28 October 2023, Colgate share price has grown at a CAGR of 14% and 11% in the last five and three years, respectively. It reached an all-time high level of ₹2,096 on 27th September 2023. The market cap of Colgate Palmolive (India) Ltd. is ₹56,587 crores.

Peer Comparison

Company NameColgate PalmoliveDaburHind. Unilever
Face Value₹1₹1₹1
Share Price (as of 26 Oct 23)₹2032.5₹506.65₹2476.15
P/E Ratio  (as of 26 Oct 23)49.7564.0956.78
Market Capitalization₹55,784 crores₹92,748 crores₹5,81,970 crores
Revenue₹5,188 crores₹11,529.9 crores₹58,154 crores
Operating Profit Margin (FY23)26%18.8%21.7%
Net Profit Margin (FY23)20%14.8%17.1%
ROCE (FY23)84%26.95%101.9% 
Distribution Network (FY23)1.7 million retail stores7.7 million retail stores9 million retail stores

Key Highlights

  • Colgate is the most prominent oral care company in India, with more than 50% market share in the toothpaste category.
  • The company has been ranked India’s most trusted oral care brand for the ninth consecutive year from 2011 to 2019 by the Economic Times- Brand Equity, conducted by Neilsen.
  • For the quarter that ended on 30th June 2023, the company reported the highest-ever quarterly revenue growth in recent times, driven by early signs of recovery in the rural market. The toothpaste category witnessed double-digit sales growth during the period.
  • The company is focusing on the premiumization of toothpaste products, which has been the cornerstone of its growth strategy. Total Sensitive Toothpaste, CLGT water flosser, Visible white O2 TP & Whitening Pen, and Colgate Periogard Toothpaste are all expected to contribute to long-term revenue growth.
  • There is enough headroom for growth in the toothpaste category as the company, through its multiple awareness programs, focuses on increasing the frequency of brushing in India. 55% of rural households don’t brush daily, while only 20% of urban households brush twice daily.
  • The per capita toothpaste consumption in India is low compared to other developing nations like Brazil, the Philippines, etc. Brazil’s per capita consumption of toothpaste is 3X more than what Indians consume annually.
  • The company has also increased its focus to grow hand and body wash products under Palmolive brands faster than the average growth rate, given its low market penetration of 2%.

Brief Industry Overview

  • The size of the Indian oral care market in 2022 was around $641 million in 2022 and is expected to expand at a CAGR of 9.2% between 2022 and 2030 to reach around $1.3 billion, according to insights10 report.
  • With oral issues becoming more prevalent in India with changing lifestyles, increased consumption of sugar in daily diet, and living standards, demand for oral hygiene products will increase.
  • The National Oral Health Programme (NOHP), the flagship program of the Government of India, will also contribute to expanding oral hygiene in India. This program aims to improve oral hygiene standards in India, provide accessible, affordable, and high-quality health care, and reduce morbidity associated with oral disease.
  • With the entry of new players, the oral care industry is experiencing increased competition among players, which reduces pricing flexibility. Colgate benefits from its parent company, which has a strong R&D capability and can launch new and innovative products at greater speed.

FAQs

  1. When was Colgate-Palmolive established in India?

    Colgate was established in 1806 by William Colgate in New York City as a soap and candle company. Later, in 1873, Colgate added toothpaste to its product portfolio. The company started its operation in India in 1937 with the launch of dental cream.

  2. How has Colgate share price performed in the last five years?

    As of 13 October 2023, Colgate share price has given a CAGR return of 13% in the last five years.  It reached an all-time high level of ₹2,096 on 27th September 2023.

  3. Are Colgate and Colgate-Palmolive same?

    Yes, Colgate and Colgate-Palmolive are the same. Palmolive-Peet acquired Colgate in 1928 to create Colgate-Palmolive-Peet Company. Later, in 1953, the company renamed itself to Colgate Palmolive.

In India, the paint industry has been long characterized by the dominance of two significant players, Asian Paints and Berger […]

In India, the paint industry has been long characterized by the dominance of two significant players, Asian Paints and Berger Paints. Despite aggressive marketing strategies and product launches, no other player in the industry has successfully become a market leader.

However, the paint industry is witnessing a fresh wave of disruption with the entry of two new players, Grasim and JSW Paints. This article will explain India’s oldest paint company, Berger Paints, the company and Berger share price.

Brief Overview of Berger Paints

Berger Paints has a very long history in manufacturing colors, and its origin and name date back to over two & a half centuries in England in 1760. The company was started by a young color chemist, Lewis Berger, and his innovation and creation in the world of colors impressed every designer and householder.

Now, the India division of the company was not established by Berger Paints but is a result of an acquisition.

Timeline of Berger Paints India Ltd

  • 1923: Incorporated as Hadfield’s (India) Limited in Kolkata
  • 1947: British Paints (Holdings) Limited took over the company. The name changed to Britsh Paints (India) Limited
  • 1965: Celanese Corporation, USA, acquired the controlling interest of British Paints (Holdings) Limited, including its India division
  • 1969: Celanese Corporation sold its Indian interest to Berger, Jenson & Nicholson, U.K. British Paints (India) Limited became part of Berger Group.
  • 1973: British Paints (India) Limited changed its name to Berger Paints India Limited
  • 1976: Foreign holding of the company diluted to below 40% by the sale of shares to the UB Group
  • 1991: UB Group sold its stake to Delhi-based Dhingra brothers (Mr. K.S. Dhingra and Mr. G.S. Dhingra) and their associates of the UK Paints Group. Presently, the Dhingra brothers own a majority stake in the company, almost 73%.

Today, Berger Paints India Limited is the second-largest paint company in India after Asian Paints, with a consistent track record of being one of the fastest-growing paint companies in India.

Business Overview of Berger Paints

Berger Paints is one of the leading paint companies in India and offers its products in the following categories:

Exterior Painting: In this category, the company offers paint products for painting exterior walls of houses strategically designed to cater to specific needs in different regions. Products like WeatherCoat Longlife 10 and WeatherCoat Longlife Flexo are available under this category.

Construction Chemicals: Under this division, the company offers waterproofing solutions. The division crossed ₹1,000 crores in sales in FY23.

Protection: Under this category, the company offers a wide range of coating solutions for various industrial applications, including oil refineries, power plants, railway bridges and coaches, and others. Berger Protection is the industry leader in the segment.

Automotive- General Industrial Coatings: This segment offers coating solutions for CED Coating, Commercial vehicles, heavy construction equipment, and 2-wheelers.

Powder Coatings: The company offers advanced powder coating technologies catering to various industries and applications.

Key Management Personnel

  • Mr. Abhijit Roy is the Managing Director & CEO of Berger Paints and has held the position since 1 July 2012. He graduated in Mechanical Engineering from Jadavpur University and did his post-graduation in business administration from IIM-Bangalore.
  • Mr. Kaushik Ghosh is Vice President and Chief Financial Officer and joined the company in June 2000. He is a qualified Chartered Accountant and Cost Accountant. Mr. Ghosh started his career in McNally Bharat Engineering Company.
  • Mr. K.K Sai is Senior Vice President of Marketing and Sales and started his career as a Management Trainee in Berger Paints around 2000. He has graduated in Chemical Engineering from IIT Chennai and did his MBA from FMS Delhi.

Shareholding Pattern

image 108
Source: Annual Reports

Berger Paints Financial Overview

Revenue

In FY23, Berger Paints reported a year-on-year topline growth of 20.6% at ₹10,568 crores, compared to ₹8,762 crores in FY22. The revenue has grown in the last five years at a CAGR of 15.39%. And, in Q1FY24, total revenue increased by 9.8% to ₹3,029.51 crores, from ₹2759.70 crores in Q1FY23.

image 107
Source: Quarterly Reports

EBITDA

In FY23, the company reported a 10.2% annual growth in EBITDA to ₹1,538.77 crores, compared to ₹1,395.66 crores. And, in Q1FY23, the EBITDA was ₹556.75 crores, which increased by 37.5% every year from ₹404.84 crores over the corresponding quarter of the last year.

image 110
 FY19FY20FY21FY22FY23
EBITDA Margin (in %)16.4217.7418.1815.9314.56
Source: Quarterly Reports

Net Profit

In FY23, the company’s net profit witnessed a year-on-year growth of 3.2% to ₹860 crores, compared to ₹833 crores in FY22. And, in Q1FY24, the company’s net profit was ₹354.91 crores, a 39.9% increase over Q1FY23’s net profit of ₹253.71 crores. The increase is because of favorable raw material costs and operational efficiencies.

image 111
Source: Quarterly Reports

Key Financial Ratios

Current Ratio: The company’s current ratio increased to 1.52 times on 30th June 2023 from 1.34 times at the end of 31st March 2023.

Debt-to-equity Ratio: The company’s debt-to-equity ratio improved to 0.16 times at the end of 30th June 2023 from 0.25 times at the end of FY23.

Debt Service Coverage Ratio: The company’s debt service coverage ratio at the end of 30th June 2023 is 10.61 times, compared to 6.76 times at the end of FY23.

Interest Service Coverage Ratio: The company’s ability to service interest expense increased to 24.71 times for the quarter ending on 30th June 2023, compared to 13.31 times at the end of FY23.

Inventory Turnover Ratio: For the quarter ending on 30th June 2023, the inventory turnover ratio increased to 0.84 times, compared to 0.67 times in the previous quarter that ended on 31st March 2023.

Return on Capital Employed (ROCE): The ROCE of the company declined marginally to 22.15% at the end of FY23, compared to 22.74% at the end of FY22. 

Berger Paints Share Price Analysis

Berger Paints has generated massive wealth for investors since its listing in the 1960s. The company’s shares have been split twice, and seven bonus issues have been announced. After splits and bonus issues, 100 shares issued at public listing have now become ~17740 shares.

AnnouncementFace ValueRatioNumber of Shares
Pre-bonus and split share₹10100
Bonus Issue- 15 June 1967₹101:2150
Bonus Issue- 15 June 1973₹107:15220
Bonus Issue- 7 October 1998₹101:1440
Bonus Issue- 30 January 2004₹101:2660
Stock Split- 13 April 2004₹210:23300
Bonus Issue- 6 June 2006₹23:55280
Stock Split- 8 January 2015₹12:110560
Bonus Issue- 30 May 2016₹12:514784
Bonus Issue- 9 August 2023₹11:5~17740

The company also has a consistent track record of paying dividends to its shareholders. It paid ₹2.8 in 2021, ₹3.1 in 2022, and ₹3.2 in 2023 as dividends.

berger
Source: TradingView

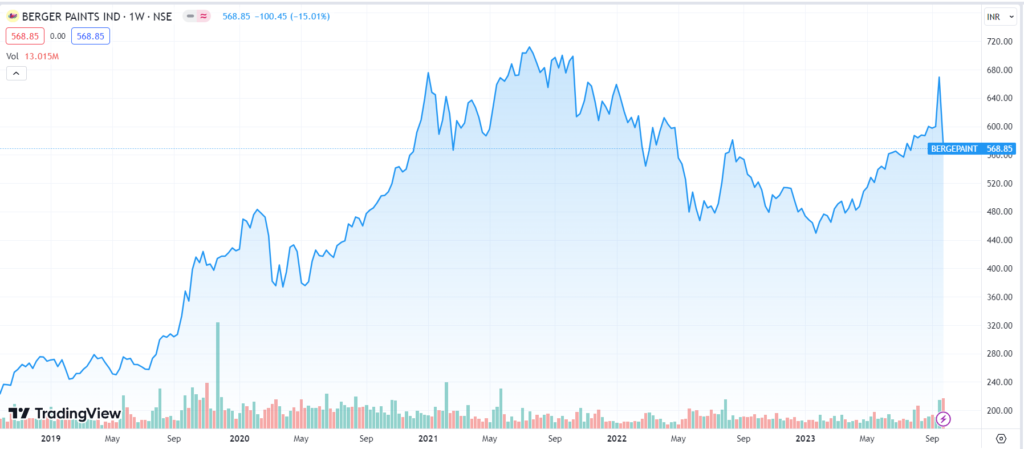
As of 3rd October 2023, Berger Paints’ share price has given a CAGR return of 19% and 5% in the last five and three years, respectively. It has reached an all-time high of ₹727 in July 2021. The market cap of Berger Paints on 3rd October 2023 is ₹65,448 crores.

Peer Comparison

Company NameBerger PaintsAsian PaintsIndigo Paints
Face Value₹1₹1₹10
Share Price (as of 3rd October)₹561.50₹3166.85₹1518.85
P/E Ratio (as of 3rd October)68.1565.2150.47
Market Capitalization₹65,448 crores₹303734.73 crores₹7233.14 crores
Revenue₹10,568 crores₹29,953.1 crores₹1,073.3 crores
EBITDA Margin (FY23)14.56%21.1%16.91%
Net Profit Margin (FY23)8.14%12.2%12.18%
ROCE (FY23)22.15%38%20.9%
Distribution Network (FY23)More than 60,000 retail touchpointsMore than 1.5 lakh retail touchpointsMore than 16,000 dealers

Key Highlights

  • The company expanded its market share from 19.3% in Q4FY23 to 20.2% in Q1FY24.
  • During Q1FY24, the company increased its retail touchpoints by incorporating over 1,500 stores and 1,300 color bank machines. The company closed FY23 with over 60,000 retail touchpoints.
  • In Q1FY24, the waterproofing and construction chemical segment witnessed robust growth.
  • In the Q1FY24 earnings con call, the management said it intends to maintain EBITDA margin within the range of 16-18% in FY24.

Brief Industry Overview

  • The market size of the Indian paints and coating industry is about $8.64 billion in 2023. As per estimates by the Indian Paint Association, it is expected to be worth $12.64 billion in the next five years.
  • The decorative paints segment is the mainstay of the Indian paints and coating industry and witnessed strong growth in 2022 on the back of the vibrant construction sector.
  • Urbanization is the critical driver of the growth of the decorative paint segment. Currently, 34% of India’s population resides in urban areas. And by 2035, it is expected to grow to 43.2%, according to the 2022 United Nations Report.
  • 30% of the revenue of India’s paint and coating industry is generated from industrial applications, which have rapidly grown over the years.
  • Capex by industry stands at ₹20,000 crores, out of which ₹10,000 crores will be spent by the Grasim and about ₹8,000 crores by Asian Paints. JSW Paints has planned a capex outlay of ₹750-1000 crores in the next two to three years.

*Disclaimer Note: The securities quoted, if any, are for illustration only and are not recommendatory. This article is for education purposes only and shall not be considered as recommendation or investment advice by Research & Ranking. We will not be liable for any losses that may occur. Investment in securities market are subject to market risks. Read all the related documents carefully before investing. Registration granted by SEBI, membership of BASL, and certification from NISM in no way guarantee the performance of the intermediary or provide any assurance of returns to investors.
FAQs

  1. How has Berger share price performed in the last five years?

    As of 29th September 2023, Berger share price has given a CAGR return of 19% in the last five years. It has reached an all-time high of ₹727 in July 2021.

  2. When was Berger Paints India Limited incorporated?

    Berger Paints India Limited was initially incorporated in1923 as Hadfield’s (India) Limited in Kolkata. The company changed multiple hands, was acquired by Berger Group in 1969, and changed its name to Berger Paints (India) Limited in 1973. Presently, the majority stake of the company is owned by the Delhi-based Dhingra brothers, who have retained the company’s name.

  3. Is Berger Paint a good paint company?

    Berger Paint is the second-largest paint company in India after Asian Paints.

No more posts to show

Frequently asked questions

Get answers to the most pertinent questions on your mind now.

An investment advisory firm is a company that helps investors make decisions about buying and selling securities (like stocks) in exchange for a fee. They can advise clients directly or provide advisory reports and other publications about specific securities, such as high growth stock recommendations. Some firms use both methods, like Research & Ranking, India’s leading stock advisory company, specializing in smart investments and long-term stocks since 2015.

An investment advisory firm is a company that helps investors make decisions about buying and selling securities (like stocks) in exchange for a fee. They can advise clients directly or provide advisory reports and other publications about specific securities, such as high growth stock recommendations. Some firms use both methods, like Research & Ranking, India’s leading stock advisory company, specializing in smart investments and long-term stocks since 2015.
What is an Investment Advisory Firm?

An investment advisory firm is a company that helps investors make decisions about buying and selling securities (like stocks) in exchange for a fee. They can advise clients directly or provide advisory reports and other publications about specific securities, such as high growth stock recommendations. Some firms use both methods, like Research & Ranking, India’s leading stock advisory company, specializing in smart investments and long-term stocks since 2015.

An investment advisory firm is a company that helps investors make decisions about buying and selling securities (like stocks) in exchange for a fee. They can advise clients directly or provide advisory reports and other publications about specific securities, such as high growth stock recommendations. Some firms use both methods, like Research & Ranking, India’s leading stock advisory company, specializing in smart investments and long-term stocks since 2015.

An investment advisory firm is a company that helps investors make decisions about buying and selling securities (like stocks) in exchange for a fee. They can advise clients directly or provide advisory reports and other publications about specific securities, such as high growth stock recommendations. Some firms use both methods, like Research & Ranking, India’s leading stock advisory company, specializing in smart investments and long-term stocks since 2015.

An investment advisory firm is a company that helps investors make decisions about buying and selling securities (like stocks) in exchange for a fee. They can advise clients directly or provide advisory reports and other publications about specific securities, such as high growth stock recommendations. Some firms use both methods, like Research & Ranking, India’s leading stock advisory company, specializing in smart investments and long-term stocks since 2015.

Who we are

SEBI registered investment advisory services

Media, Award & Accolades

Stay updated with our winning journey

Video Gallery

Watch our exclusively curated financial videos

Performance

Know the journey of stocks

Newsletters

Stay on top of the stock market

Contact us

Stay in touch

5 in 5 Strategy

A portfolio of 20-25 potential high-return stocks

MPO

1 high-growth stock recommendation/ month, that is trading below its intrinsic value

Combo

A combined solution of 5-in-5 wealth creation strategy & mispriced opportunities

Dhanwaan

Manage your portfolio with dhanwaan

Informed InvestoRR

A step by step guide to sharpen your investing skills

EPW Coming soon

A concentrated portfolio of 12-18 high-growth & emerging theme stocks

Pricing

Choose from our range of pricing packages